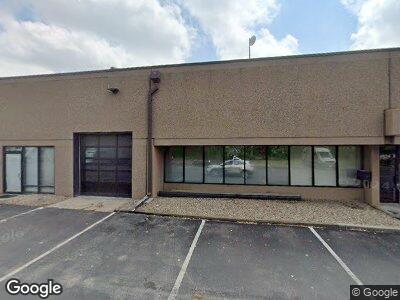
4820 Sterling Dr Boulder, CO 80301
Estimated Value: $5,079,060
--
Bed
--
Bath
25,364
Sq Ft
$200/Sq Ft
Est. Value
About This Home
This home is located at 4820 Sterling Dr, Boulder, CO 80301 and is currently estimated at $5,079,060, approximately $200 per square foot. 4820 Sterling Dr is a home located in Boulder County with nearby schools including Columbine Elementary School, Casey Middle School, and Boulder High School.
Ownership History
Date
Name
Owned For
Owner Type
Purchase Details
Closed on
May 7, 2024
Sold by
Pine Valley Llc Iii
Bought by
Realm Dimension Llc
Current Estimated Value
Home Financials for this Owner
Home Financials are based on the most recent Mortgage that was taken out on this home.
Original Mortgage
$2,220,000
Outstanding Balance
$2,208,791
Interest Rate
6.94%
Mortgage Type
Small Business Administration
Estimated Equity
$3,207,009
Purchase Details
Closed on
Oct 30, 2017
Sold by
Saunders R Michael and Sterling Now Llc
Bought by
Sterling Corner Llc
Home Financials for this Owner
Home Financials are based on the most recent Mortgage that was taken out on this home.
Original Mortgage
$2,000,000
Interest Rate
3.78%
Mortgage Type
Purchase Money Mortgage
Purchase Details
Closed on
Apr 2, 1982
Bought by
Sterling Partnership
Create a Home Valuation Report for This Property
The Home Valuation Report is an in-depth analysis detailing your home's value as well as a comparison with similar homes in the area
Home Values in the Area
Average Home Value in this Area
Purchase History
| Date | Buyer | Sale Price | Title Company |
|---|---|---|---|
| Realm Dimension Llc | $5,400,000 | Land Title | |
| Sterling Corner Llc | -- | Stewart Title | |
| Saunders R Michael | -- | Stewart Title | |
| Sterling Partnership | $212,000 | -- |
Source: Public Records
Mortgage History
| Date | Status | Borrower | Loan Amount |
|---|---|---|---|
| Open | Realm Dimension Llc | $2,220,000 | |
| Closed | Realm Dimension Llc | $2,160,000 | |
| Closed | Realm Dimension Llc | $2,700,000 | |
| Previous Owner | Pine Valley Llc Iii | $3,000,000 | |
| Previous Owner | Sterling Corner Llc | $2,000,000 |
Source: Public Records
Tax History Compared to Growth
Tax History
| Year | Tax Paid | Tax Assessment Tax Assessment Total Assessment is a certain percentage of the fair market value that is determined by local assessors to be the total taxable value of land and additions on the property. | Land | Improvement |
|---|---|---|---|---|
| 2024 | $141,382 | $1,637,144 | $895,255 | $741,889 |
| 2023 | $141,382 | $1,637,144 | $895,255 | $741,889 |
| 2022 | $93,934 | $1,011,520 | $471,250 | $540,270 |
| 2021 | $87,067 | $1,011,520 | $471,250 | $540,270 |
| 2020 | $84,918 | $975,560 | $471,250 | $504,310 |
| 2019 | $83,618 | $975,560 | $471,250 | $504,310 |
| 2018 | $71,783 | $827,950 | $324,058 | $503,892 |
| 2017 | $69,537 | $827,950 | $324,058 | $503,892 |
| 2016 | $67,780 | $1,019,930 | $704,613 | $315,317 |
| 2015 | $83,606 | $739,703 | $271,237 | $468,466 |
| 2014 | $62,195 | $739,703 | $271,237 | $468,466 |
Source: Public Records
Map
Nearby Homes
- 3076 Fulton Cir
- 4861 Curie Ct
- 3105 Galileo Ln
- 4855 Edison Ave Unit 112
- 3116 47th St
- 4866 Franklin Dr
- 3228 47th St
- 146 Butte St Unit 146
- 3405 Valmont Rd Unit B
- 3405 Valmont Rd Unit A
- 4829 Baldwin Place
- 3260 47th St Unit 201A
- 3260 47th St Unit 207A
- 3260 47th St Unit 108A
- 3260 47th St Unit 206A
- 3260 47th St Unit 205A
- 3294 Sentinel Dr
- 2445 Junction Place Unit 304
- 2445 Junction Place Unit 206
- 3215 Foundry Place Unit 106N
- 4820 Sterling Dr
- 4822 Sterling Dr
- 4824 Sterling Dr
- 4805 Sterling Dr
- 3100 Sterling Cir
- 4790 Pearl St
- 4790 Pearl St Unit 3
- 4790 Pearl St Unit 2
- 4770 Pearl St Unit F
- 3057 Kings Ridge Blvd
- 3000 Edison Ct
- 3006 Edison Ct
- 3012 Edison Ct
- 3018 Edison Ct
- 3046 Fulton Cir
- 3036 Fulton Cir
- 3044 Fulton Cir
- 3048 Fulton Cir
- 3038 Fulton Cir
- 3034 Fulton Cir