Estimated Value: $723,000 - $767,000
4
Beds
2
Baths
1,599
Sq Ft
$466/Sq Ft
Est. Value
About This Home
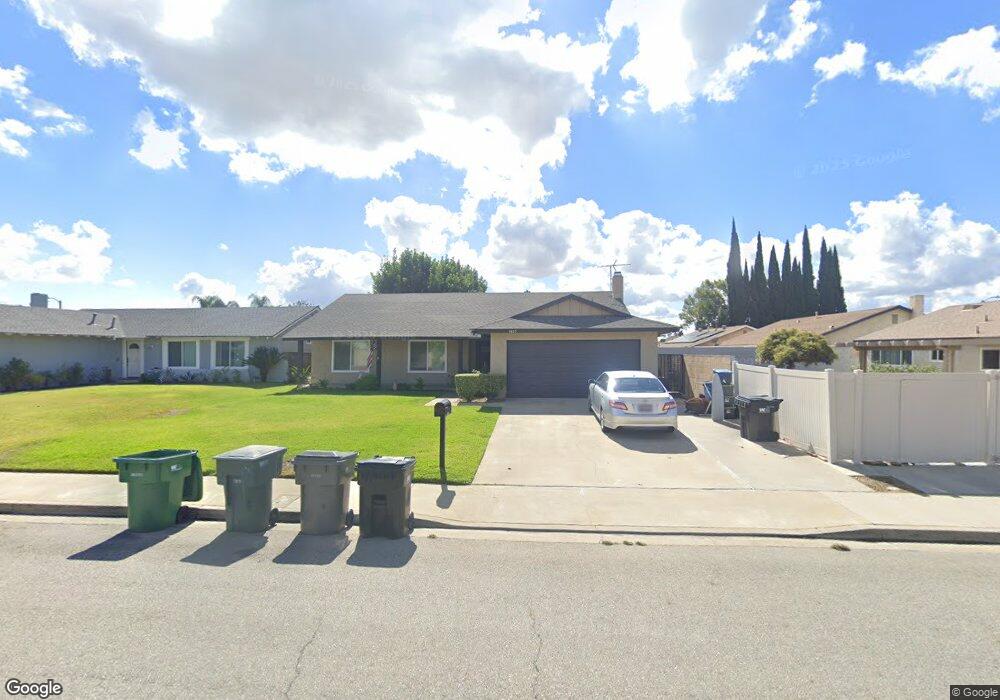
This home is located at 4825 Davis St, Chino, CA 91710 and is currently estimated at $745,271, approximately $466 per square foot. 4825 Davis St is a home located in San Bernardino County with nearby schools including Newman Elementary, Ramona Junior High School, and Don Antonio Lugo High School.
Ownership History
Date
Name
Owned For
Owner Type
Purchase Details
Closed on
Mar 16, 2006
Sold by
Burciaga Francisco
Bought by
Burciaga Francisco and Burciaga Veronica
Current Estimated Value
Home Financials for this Owner
Home Financials are based on the most recent Mortgage that was taken out on this home.
Original Mortgage
$300,000
Outstanding Balance
$171,544
Interest Rate
6.37%
Mortgage Type
Purchase Money Mortgage
Estimated Equity
$573,727
Purchase Details
Closed on
Dec 24, 1998
Sold by
Burciaga Francisco and Burciaga Ruben
Bought by
Burciaga Francisco and Burciaga Veronia
Home Financials for this Owner
Home Financials are based on the most recent Mortgage that was taken out on this home.
Original Mortgage
$114,500
Interest Rate
6.63%
Purchase Details
Closed on
Jun 14, 1994
Sold by
Burciaga Francisco
Bought by
Burciaga Francisco and Burciaga Ruben
Home Financials for this Owner
Home Financials are based on the most recent Mortgage that was taken out on this home.
Original Mortgage
$122,500
Interest Rate
6.75%
Create a Home Valuation Report for This Property
The Home Valuation Report is an in-depth analysis detailing your home's value as well as a comparison with similar homes in the area
Home Values in the Area
Average Home Value in this Area
Purchase History
| Date | Buyer | Sale Price | Title Company |
|---|---|---|---|
| Burciaga Francisco | -- | Chicago Title Co | |
| Burciaga Francisco | -- | Stewart Title | |
| Burciaga Francisco | -- | Chicago Title Co |
Source: Public Records
Mortgage History
| Date | Status | Borrower | Loan Amount |
|---|---|---|---|
| Open | Burciaga Francisco | $300,000 | |
| Closed | Burciaga Francisco | $114,500 | |
| Closed | Burciaga Francisco | $122,500 |
Source: Public Records
Tax History
| Year | Tax Paid | Tax Assessment Tax Assessment Total Assessment is a certain percentage of the fair market value that is determined by local assessors to be the total taxable value of land and additions on the property. | Land | Improvement |
|---|---|---|---|---|
| 2025 | $3,266 | $291,763 | $72,900 | $218,863 |
| 2024 | $3,180 | $286,043 | $71,471 | $214,572 |
| 2023 | $3,092 | $280,435 | $70,070 | $210,365 |
| 2022 | $3,074 | $274,936 | $68,696 | $206,240 |
| 2021 | $3,014 | $269,545 | $67,349 | $202,196 |
| 2020 | $2,975 | $266,781 | $66,658 | $200,123 |
| 2019 | $2,923 | $261,550 | $65,351 | $196,199 |
| 2018 | $2,859 | $256,422 | $64,070 | $192,352 |
| 2017 | $2,808 | $251,394 | $62,814 | $188,580 |
| 2016 | $2,625 | $246,464 | $61,582 | $184,882 |
| 2015 | $2,572 | $242,762 | $60,657 | $182,105 |
| 2014 | $2,522 | $238,007 | $59,469 | $178,538 |
Source: Public Records
Map
Nearby Homes
- 12488 Monte Vista Ave
- 4836 Terry Ave
- 12629 Thomas Place
- 5039 Tyler St
- 12620 Anthony Place
- 12608 Ramona Ave
- 5195 Walnut Ave Unit 14
- 12931 4th St
- 12124 Lester Ct
- 13065 San Clemente Ln
- 4610 Philadelphia St
- 13079 Monte Vista Ave
- 4965 Independence St
- 13123 2nd St
- 11938 Vista Ave
- 11910 Carlisle Ave
- 4152 Kennedy Ct
- 13148 Derby Ave
- 4400 Philadelphia St Unit 71
- 13239 2nd St
- 4837 Davis St
- 12569 Russell Ave
- 12573 Russell Ave
- 12585 Russell Ave
- 4859 Davis St
- 12582 Lewis Ave
- 12591 Russell Ave
- 12590 Lewis Ave
- 12544 Lewis Ave
- 12545 Russell Ave
- 12605 Russell Ave
- 12606 Lewis Ave
- 12538 Lewis Ave
- 12539 Russell Ave
- 0 Russell Ave
- 12568 Russell Ave
- 12572 Russell Ave
- 12577 Lewis Ave
- 12565 Lewis Ave
- 12584 Russell Ave
Your Personal Tour Guide
Ask me questions while you tour the home.