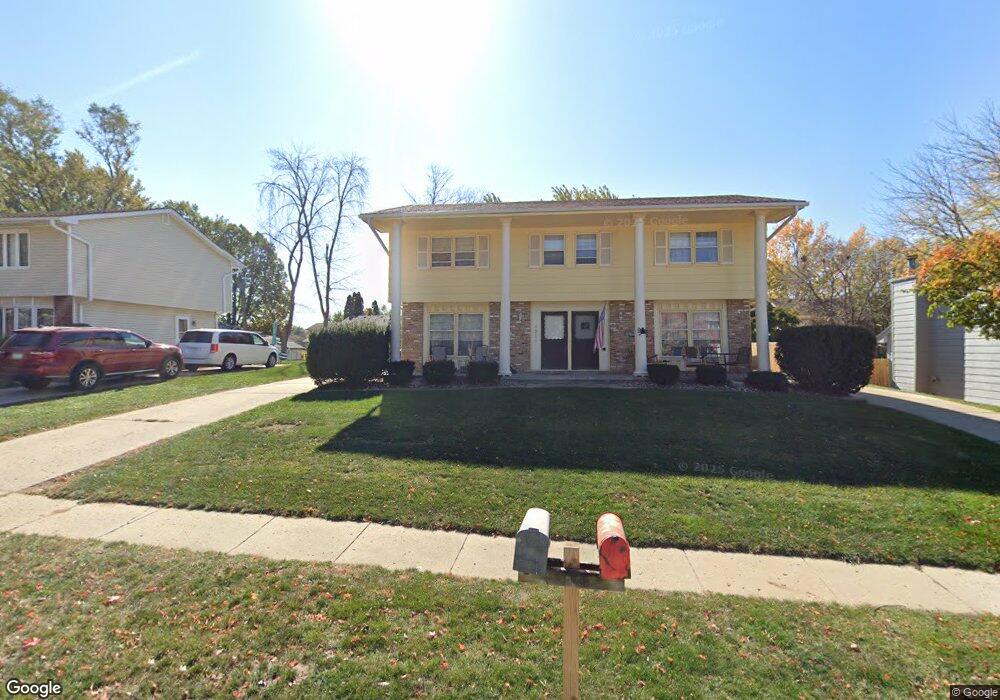
4826 & 4828 Twana Dr Des Moines, IA 50310
Meredith NeighborhoodEstimated Value: $303,000 - $324,285
6
Beds
2
Baths
2,216
Sq Ft
$143/Sq Ft
Est. Value
About This Home
This home is located at 4826 & 4828 Twana Dr, Des Moines, IA 50310 and is currently estimated at $317,571, approximately $143 per square foot. 4826 & 4828 Twana Dr is a home located in Polk County with nearby schools including Lawson Elementary School, Johnston Middle School, and Summit Middle School.
Ownership History
Date
Name
Owned For
Owner Type
Purchase Details
Closed on
Jan 23, 2025
Sold by
Hart James A
Bought by
Hart Property Management Llc
Current Estimated Value
Purchase Details
Closed on
Jan 12, 2011
Sold by
Sonberg Shane and Sonberg Lora
Bought by
Hart James A
Home Financials for this Owner
Home Financials are based on the most recent Mortgage that was taken out on this home.
Original Mortgage
$126,000
Interest Rate
4.65%
Mortgage Type
New Conventional
Create a Home Valuation Report for This Property
The Home Valuation Report is an in-depth analysis detailing your home's value as well as a comparison with similar homes in the area
Home Values in the Area
Average Home Value in this Area
Purchase History
| Date | Buyer | Sale Price | Title Company |
|---|---|---|---|
| Hart Property Management Llc | -- | None Listed On Document | |
| Hart Property Management Llc | -- | None Listed On Document | |
| Hart James A | $167,500 | None Available |
Source: Public Records
Mortgage History
| Date | Status | Borrower | Loan Amount |
|---|---|---|---|
| Previous Owner | Hart James A | $126,000 |
Source: Public Records
Tax History Compared to Growth
Tax History
| Year | Tax Paid | Tax Assessment Tax Assessment Total Assessment is a certain percentage of the fair market value that is determined by local assessors to be the total taxable value of land and additions on the property. | Land | Improvement |
|---|---|---|---|---|
| 2025 | $5,544 | $325,800 | $54,800 | $271,000 |
| 2024 | $5,544 | $287,100 | $47,500 | $239,600 |
| 2023 | $5,462 | $287,100 | $47,500 | $239,600 |
| 2022 | $6,022 | $243,900 | $42,300 | $201,600 |
| 2021 | $5,948 | $243,900 | $42,300 | $201,600 |
| 2020 | $5,840 | $229,500 | $39,500 | $190,000 |
| 2019 | $5,496 | $229,500 | $39,500 | $190,000 |
| 2018 | $5,442 | $205,600 | $34,600 | $171,000 |
| 2017 | $5,062 | $205,600 | $34,600 | $171,000 |
| 2016 | $4,940 | $188,100 | $31,500 | $156,600 |
| 2015 | $4,940 | $188,100 | $31,500 | $156,600 |
| 2014 | $4,463 | $167,200 | $26,400 | $140,800 |
Source: Public Records
Map
Nearby Homes