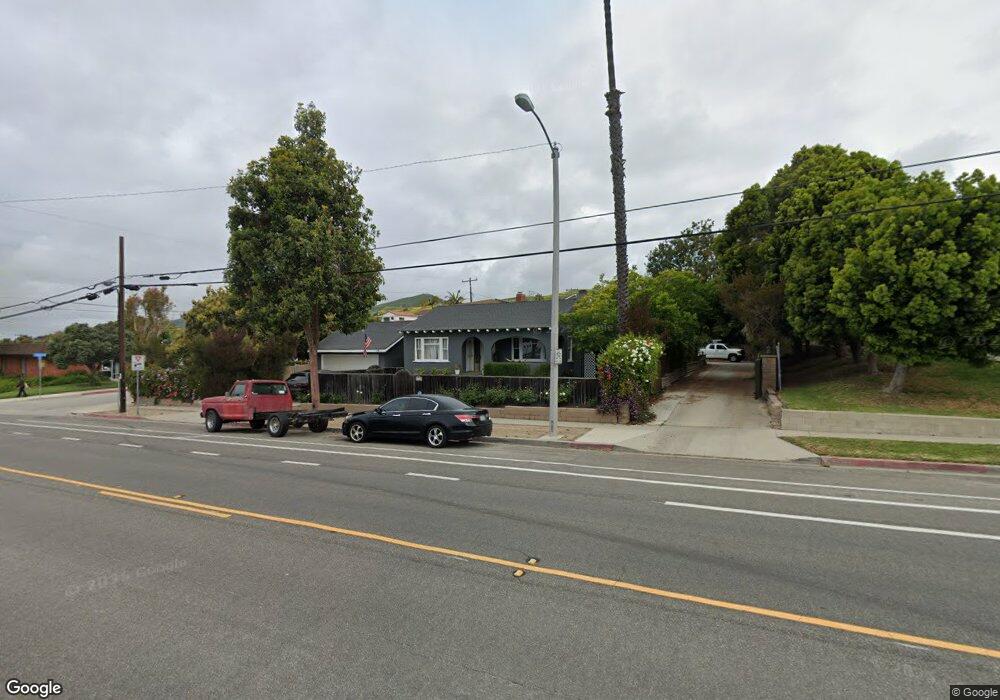
4827 Loma Vista Rd Ventura, CA 93003
College NeighborhoodEstimated Value: $887,866 - $1,034,000
3
Beds
1
Bath
1,448
Sq Ft
$685/Sq Ft
Est. Value
About This Home
This home is located at 4827 Loma Vista Rd, Ventura, CA 93003 and is currently estimated at $992,217, approximately $685 per square foot. 4827 Loma Vista Rd is a home located in Ventura County with nearby schools including Loma Vista Elementary School, Cabrillo Middle School, and Ventura High School.
Ownership History
Date
Name
Owned For
Owner Type
Purchase Details
Closed on
Jul 21, 2014
Sold by
Reginato Katherine and Reginato Catherine
Bought by
Reginato Katherine and Riter Gary
Current Estimated Value
Home Financials for this Owner
Home Financials are based on the most recent Mortgage that was taken out on this home.
Original Mortgage
$191,000
Outstanding Balance
$103,769
Interest Rate
4.12%
Mortgage Type
New Conventional
Estimated Equity
$888,448
Purchase Details
Closed on
Jul 14, 1998
Sold by
Fisher James E
Bought by
Reginato Catherine
Purchase Details
Closed on
Jan 23, 1998
Sold by
Heim Matthew R and Heim Julie E
Bought by
Reginato Katherine and Fisher James Edward
Home Financials for this Owner
Home Financials are based on the most recent Mortgage that was taken out on this home.
Original Mortgage
$175,500
Interest Rate
6.97%
Create a Home Valuation Report for This Property
The Home Valuation Report is an in-depth analysis detailing your home's value as well as a comparison with similar homes in the area
Home Values in the Area
Average Home Value in this Area
Purchase History
| Date | Buyer | Sale Price | Title Company |
|---|---|---|---|
| Reginato Katherine | -- | First American Title Company | |
| Reginato Catherine | -- | -- | |
| Reginato Katherine | $195,000 | American Title Co |
Source: Public Records
Mortgage History
| Date | Status | Borrower | Loan Amount |
|---|---|---|---|
| Open | Reginato Katherine | $191,000 | |
| Previous Owner | Reginato Katherine | $175,500 |
Source: Public Records
Tax History Compared to Growth
Tax History
| Year | Tax Paid | Tax Assessment Tax Assessment Total Assessment is a certain percentage of the fair market value that is determined by local assessors to be the total taxable value of land and additions on the property. | Land | Improvement |
|---|---|---|---|---|
| 2025 | $3,265 | $305,672 | $203,789 | $101,883 |
| 2024 | $3,265 | $299,679 | $199,793 | $99,886 |
| 2023 | $3,227 | $293,803 | $195,875 | $97,928 |
| 2022 | $3,001 | $288,043 | $192,035 | $96,008 |
| 2021 | $2,949 | $282,396 | $188,270 | $94,126 |
| 2020 | $2,921 | $279,503 | $186,341 | $93,162 |
| 2019 | $2,868 | $274,024 | $182,688 | $91,336 |
| 2018 | $2,819 | $268,652 | $179,106 | $89,546 |
| 2017 | $2,767 | $263,386 | $175,595 | $87,791 |
| 2016 | $2,718 | $258,222 | $172,152 | $86,070 |
| 2015 | $2,674 | $254,345 | $169,567 | $84,778 |
| 2014 | $2,635 | $249,365 | $166,247 | $83,118 |
Source: Public Records
Map
Nearby Homes
- 4797 Loma Vista Rd
- 412 Dayloma Ave
- 275 Fairfax Ave
- 288 Byron Ave
- 262 Crestwood Ave
- 4205 Foothill Rd
- 572 Skyline Rd
- 5633 Pembroke St
- 5438 Rainier St
- 287 Oberlin Ave
- 5365 Queens St
- 4700 Aurora Dr Unit 16
- 4700 Aurora Dr Unit 75
- 4700 Aurora Dr Unit 29
- 251 Palomares Ave
- 3750 Mound Ave
- 6005 Sutter St
- 311 Rodgers St Unit 311
- 339 Carol Dr
- 24 Debussy Ln Unit 24
- 220 Walnut Dr
- 4859 Loma Vista Rd
- 4861 Loma Vista Rd
- 4855 Loma Vista Rd
- 4863 Loma Vista Rd
- 4865 Loma Vista Rd
- 234 Walnut Dr
- 240 Walnut Dr
- 228 Walnut Dr
- 245 Walnut Dr
- 250 Walnut Dr
- 4757 Loma Vista Rd
- 252 Walnut Dr
- 4753 Loma Vista Rd
- 4753 Loma Vista Rd Unit 2
- 4751 Loma Vista Rd Unit 4751-53
- 4751 Loma Vista Rd Unit 2
- 4751 Loma Vista Rd
- 247 Bayview Ave
- 251 Walnut Dr