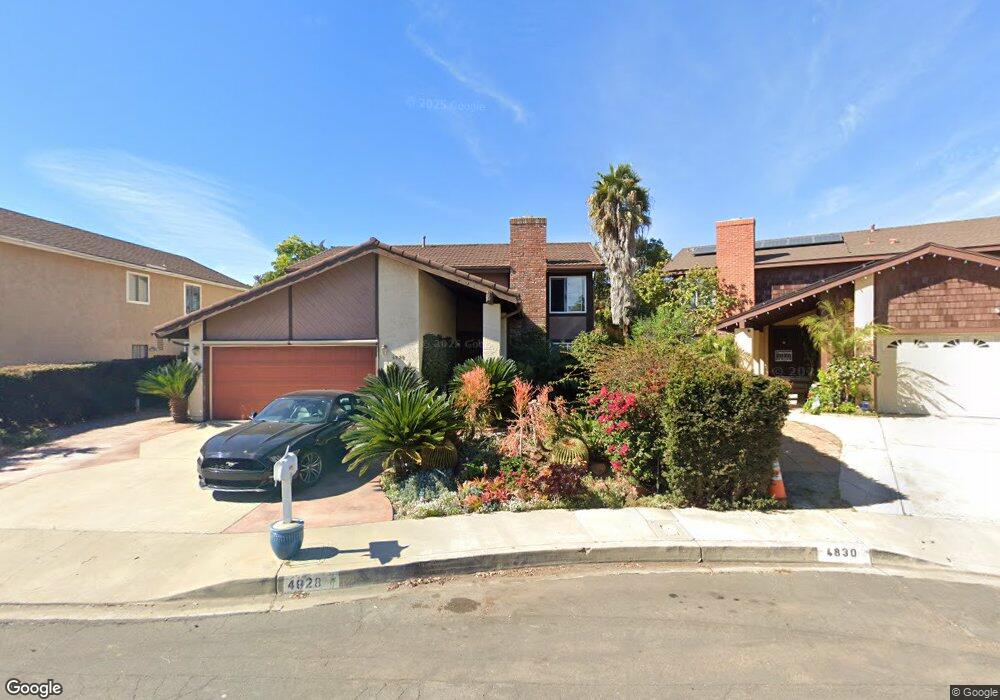
4828 Liebel Ct San Diego, CA 92117
Clairemont Mesa East NeighborhoodEstimated Value: $1,339,000 - $1,436,000
5
Beds
3
Baths
2,348
Sq Ft
$593/Sq Ft
Est. Value
About This Home
This home is located at 4828 Liebel Ct, San Diego, CA 92117 and is currently estimated at $1,392,927, approximately $593 per square foot. 4828 Liebel Ct is a home located in San Diego County with nearby schools including Lafayette Elementary, Innovation Middle School, and Madison High School.
Ownership History
Date
Name
Owned For
Owner Type
Purchase Details
Closed on
Jun 1, 2018
Sold by
Heminger Laura Tompkins
Bought by
Heminger Laura and Heminger Trust
Current Estimated Value
Purchase Details
Closed on
Sep 19, 2013
Sold by
Heminger Laura Tompkins and Tompkins Laura
Bought by
Heminger Laura Tompkins
Home Financials for this Owner
Home Financials are based on the most recent Mortgage that was taken out on this home.
Original Mortgage
$104,500
Outstanding Balance
$25,591
Interest Rate
3.57%
Mortgage Type
New Conventional
Estimated Equity
$1,367,336
Purchase Details
Closed on
Apr 7, 2003
Sold by
Silvertz Robert and Tompkins Laura
Bought by
Tompkins Laura
Home Financials for this Owner
Home Financials are based on the most recent Mortgage that was taken out on this home.
Original Mortgage
$303,100
Outstanding Balance
$130,019
Interest Rate
5.73%
Estimated Equity
$1,262,908
Purchase Details
Closed on
Oct 23, 2000
Sold by
Lewis Linda C
Bought by
Silvetz Robert and Tompkins Laura
Home Financials for this Owner
Home Financials are based on the most recent Mortgage that was taken out on this home.
Original Mortgage
$299,700
Interest Rate
7.86%
Purchase Details
Closed on
May 10, 1998
Sold by
Shurance Joseph E
Bought by
Lewis Linda C
Home Financials for this Owner
Home Financials are based on the most recent Mortgage that was taken out on this home.
Original Mortgage
$198,400
Interest Rate
7.17%
Mortgage Type
Stand Alone First
Purchase Details
Closed on
Mar 29, 1995
Sold by
Shurance Joseph
Bought by
Shurance Joseph E
Purchase Details
Closed on
Dec 8, 1994
Sold by
Shurance Joseph and Shurance Joseph E
Bought by
Shurance Joseph E
Purchase Details
Closed on
Mar 21, 1994
Sold by
Stephenson Chiyoko and Stephenson Donald
Bought by
Shurance Joseph
Home Financials for this Owner
Home Financials are based on the most recent Mortgage that was taken out on this home.
Original Mortgage
$193,500
Interest Rate
5%
Purchase Details
Closed on
Mar 7, 1994
Sold by
Shurance Joan
Bought by
Shurance Joseph
Home Financials for this Owner
Home Financials are based on the most recent Mortgage that was taken out on this home.
Original Mortgage
$193,500
Interest Rate
5%
Purchase Details
Closed on
Dec 13, 1993
Sold by
Stephenson Donald J and Stephenson Chiyoko
Bought by
Stephenson Donald J and Stephenson Chiyoko
Create a Home Valuation Report for This Property
The Home Valuation Report is an in-depth analysis detailing your home's value as well as a comparison with similar homes in the area
Home Values in the Area
Average Home Value in this Area
Purchase History
| Date | Buyer | Sale Price | Title Company |
|---|---|---|---|
| Heminger Laura | -- | None Available | |
| Heminger Laura Tompkins | -- | First American Title Company | |
| Heminger Laura Tompkins | -- | First American Title Company | |
| Tompkins Laura | -- | Lawyers Title | |
| Silvetz Robert | $333,000 | Commonwealth Land Title Co | |
| Lewis Linda C | $248,000 | Southland Title | |
| Shurance Joseph E | -- | -- | |
| Shurance Joseph E | -- | -- | |
| Shurance Joseph E | -- | -- | |
| Shurance Joseph E | -- | -- | |
| Shurance Joseph | $215,000 | Union Land Title Co | |
| Shurance Joseph | -- | Union Land Title Co | |
| Stephenson Donald J | -- | -- | |
| Stephenson Donald J | -- | -- | |
| Stephenson Chiyoko | -- | -- |
Source: Public Records
Mortgage History
| Date | Status | Borrower | Loan Amount |
|---|---|---|---|
| Open | Heminger Laura Tompkins | $104,500 | |
| Closed | Heminger Laura Tompkins | $104,500 | |
| Open | Tompkins Laura | $303,100 | |
| Closed | Silvetz Robert | $299,700 | |
| Previous Owner | Lewis Linda C | $198,400 | |
| Previous Owner | Shurance Joseph | $193,500 |
Source: Public Records
Tax History Compared to Growth
Tax History
| Year | Tax Paid | Tax Assessment Tax Assessment Total Assessment is a certain percentage of the fair market value that is determined by local assessors to be the total taxable value of land and additions on the property. | Land | Improvement |
|---|---|---|---|---|
| 2025 | $6,076 | $501,757 | $286,290 | $215,467 |
| 2024 | $6,076 | $491,920 | $280,677 | $211,243 |
| 2023 | $5,942 | $482,275 | $275,174 | $207,101 |
| 2022 | $5,784 | $472,820 | $269,779 | $203,041 |
| 2021 | $5,745 | $463,550 | $264,490 | $199,060 |
| 2020 | $5,675 | $458,797 | $261,778 | $197,019 |
| 2019 | $5,574 | $449,802 | $256,646 | $193,156 |
| 2018 | $5,212 | $440,983 | $251,614 | $189,369 |
| 2017 | $5,088 | $432,337 | $246,681 | $185,656 |
| 2016 | $5,007 | $423,861 | $241,845 | $182,016 |
| 2015 | $4,933 | $417,495 | $238,213 | $179,282 |
| 2014 | $4,856 | $409,318 | $233,547 | $175,771 |
Source: Public Records
Map
Nearby Homes
- 5656 Chandler Dr
- 5715 Castleton Dr
- 5768 Camber Dr
- 6460 Convoy Ct Unit SPC 59
- 6460 Convoy Ct Unit 185
- 6460 Convoy Ct Unit SPC 318
- 5783 Camber Dr
- 4410 Charger Blvd
- 6939 Bettyhill Dr
- 4261 Cannington Dr
- 6750 Beadnell Way Unit 3
- 6602 Beadnell Way Unit 13
- 6666 Beadnell Way Unit 9
- 6666 Beadnell Way Unit 15
- 5170 Clairemont Mesa Blvd Unit 8
- 5170 Clairemont Mesa Blvd Unit 27
- 5404 Balboa Arms Dr Unit 461
- 5124 Acuna St
- 4827 Rushden Ave
- 5402 Balboa Arms Dr Unit 345
- 4822 Liebel Ct
- 4830 Liebel Ct
- 4723 Lana Ln
- 4733 Lana Ln
- 4818 Liebel Ct
- 4834 Liebel Ct
- 4829 Liebel Ct
- 4814 Liebel Ct
- 4856 Cannington Dr
- 5975 Lana Dr
- 4823 Liebel Ct
- 4716 Lana Ln
- 4866 Cannington Dr
- 5985 Lana Dr
- 4835 Liebel Ct
- 5967 Lana Dr
- 4876 Cannington Dr
- 4810 Liebel Ct
- 4836 Cannington Dr
- 4886 Cannington Dr