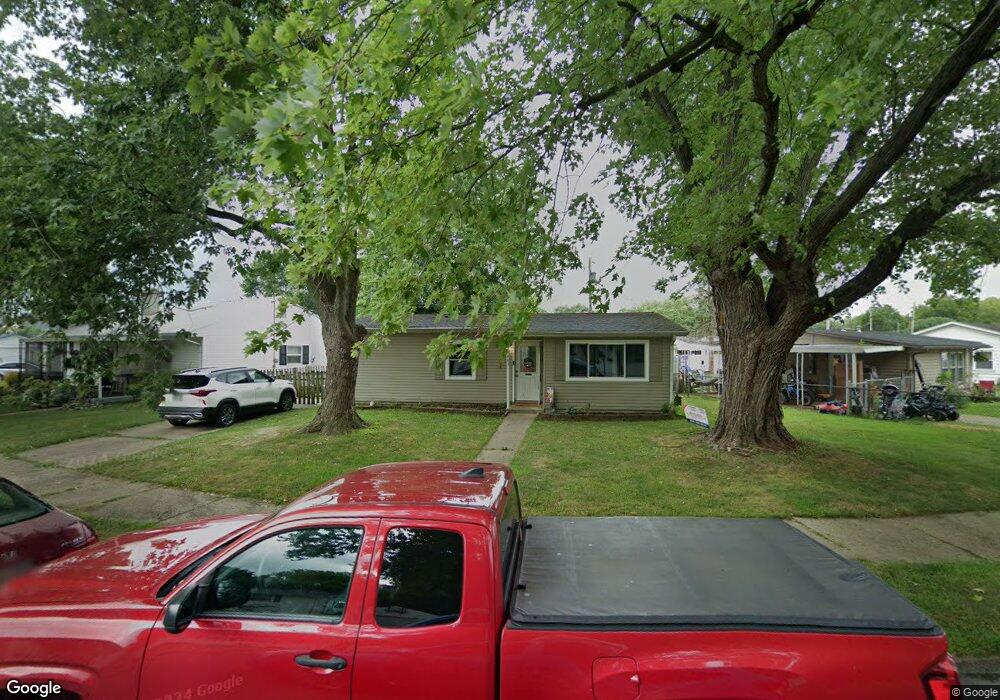
483 Stella Ave Circleville, OH 43113
Estimated Value: $143,000 - $212,000
3
Beds
1
Bath
977
Sq Ft
$193/Sq Ft
Est. Value
About This Home
This home is located at 483 Stella Ave, Circleville, OH 43113 and is currently estimated at $188,735, approximately $193 per square foot. 483 Stella Ave is a home located in Pickaway County with nearby schools including Circleville High School, Crossroads Christian Academy, and New Hope Christian Academy.
Ownership History
Date
Name
Owned For
Owner Type
Purchase Details
Closed on
Oct 31, 2022
Sold by
Crossing Bridges Investments Llc
Bought by
Sheets Kyla H
Current Estimated Value
Home Financials for this Owner
Home Financials are based on the most recent Mortgage that was taken out on this home.
Original Mortgage
$169,750
Outstanding Balance
$164,477
Interest Rate
6.94%
Mortgage Type
New Conventional
Estimated Equity
$24,258
Purchase Details
Closed on
Jul 24, 2015
Sold by
Jenkins Paul D and Jenkins Leatha A
Bought by
Crossing Bridges Investments Llc
Home Financials for this Owner
Home Financials are based on the most recent Mortgage that was taken out on this home.
Original Mortgage
$145,000
Interest Rate
4.01%
Mortgage Type
Purchase Money Mortgage
Purchase Details
Closed on
Mar 22, 2011
Sold by
Jenkins Paul D and Jenkins Leatha A
Bought by
Jenkins Paul D and Jenkins Leatha A
Purchase Details
Closed on
Dec 26, 1996
Sold by
Davis Arthur E
Bought by
Jenkins Paul D and Jenkins Leatha A
Purchase Details
Closed on
Nov 1, 1986
Create a Home Valuation Report for This Property
The Home Valuation Report is an in-depth analysis detailing your home's value as well as a comparison with similar homes in the area
Home Values in the Area
Average Home Value in this Area
Purchase History
| Date | Buyer | Sale Price | Title Company |
|---|---|---|---|
| Sheets Kyla H | $175,000 | -- | |
| Sheets Kyla H | $175,000 | None Listed On Document | |
| Crossing Bridges Investments Llc | $150,000 | Clt | |
| Jenkins Paul D | -- | None Available | |
| Jenkins Paul D | $64,900 | -- | |
| -- | $33,000 | -- |
Source: Public Records
Mortgage History
| Date | Status | Borrower | Loan Amount |
|---|---|---|---|
| Open | Sheets Kyla H | $169,750 | |
| Closed | Sheets Kyla H | $169,750 | |
| Previous Owner | Crossing Bridges Investments Llc | $145,000 |
Source: Public Records
Tax History
| Year | Tax Paid | Tax Assessment Tax Assessment Total Assessment is a certain percentage of the fair market value that is determined by local assessors to be the total taxable value of land and additions on the property. | Land | Improvement |
|---|---|---|---|---|
| 2024 | -- | $57,060 | $6,320 | $50,740 |
| 2023 | $2,057 | $57,060 | $6,320 | $50,740 |
| 2022 | $1,413 | $31,130 | $5,290 | $25,840 |
| 2021 | $1,422 | $31,130 | $5,290 | $25,840 |
| 2020 | $1,422 | $31,130 | $5,290 | $25,840 |
| 2019 | $1,222 | $25,600 | $5,290 | $20,310 |
| 2018 | $1,284 | $25,600 | $5,290 | $20,310 |
| 2017 | $2,031 | $25,600 | $5,290 | $20,310 |
| 2016 | $1,212 | $23,970 | $5,790 | $18,180 |
| 2015 | $1,180 | $23,970 | $5,790 | $18,180 |
| 2014 | $1,881 | $23,970 | $5,790 | $18,180 |
| 2013 | $1,989 | $25,780 | $5,790 | $19,990 |
Source: Public Records
Map
Nearby Homes
- 405 Watt St
- 461 Watt St
- 231 Westwood Dr
- 374 E Franklin St
- 152 Griner Ave
- 125 N Pickaway St
- 551 E Main St
- 377 E Union St
- 334 Lancaster Pike
- 461 N Court St
- 0 Ohio 56 Unit 226002334
- 575 Renick Ave
- 5658 US Highway 22 and 3
- 225 S Court St
- 546 E Ohio St
- 420 Faye Ave
- 116 Highland Ave
- 705 Clinton St
- 364 Barnes Ave
- 837 Clinton St