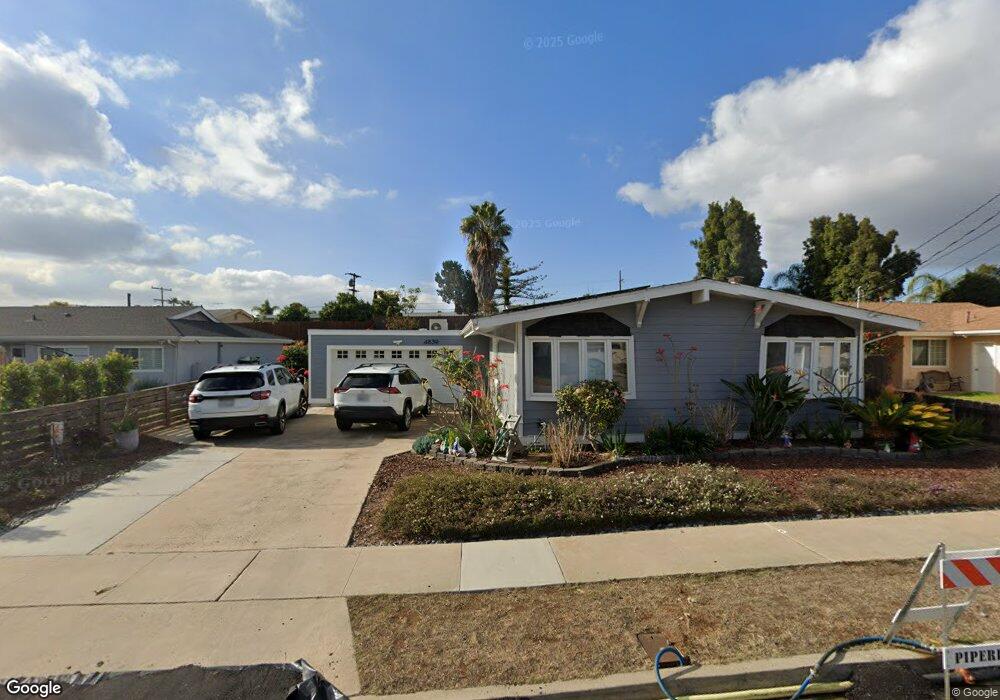
4839 Mount la Platta Dr San Diego, CA 92117
Clairemont Mesa East NeighborhoodEstimated Value: $1,052,383 - $1,201,000
3
Beds
2
Baths
1,662
Sq Ft
$686/Sq Ft
Est. Value
About This Home
This home is located at 4839 Mount la Platta Dr, San Diego, CA 92117 and is currently estimated at $1,140,346, approximately $686 per square foot. 4839 Mount la Platta Dr is a home located in San Diego County with nearby schools including Holmes Elementary, Marston Middle School, and Clairemont High School.
Ownership History
Date
Name
Owned For
Owner Type
Purchase Details
Closed on
Oct 18, 2021
Sold by
Kaliff Wayne and Kaliff Mary E
Bought by
Kaliff Wayne and Kaliff Mary E
Current Estimated Value
Home Financials for this Owner
Home Financials are based on the most recent Mortgage that was taken out on this home.
Original Mortgage
$365,700
Outstanding Balance
$309,218
Interest Rate
2.8%
Mortgage Type
New Conventional
Estimated Equity
$831,128
Purchase Details
Closed on
Sep 18, 2018
Sold by
Kaliff Wayne and Kaliff Mary E
Bought by
Kaliff Wayne and Kaliff Mary E
Purchase Details
Closed on
Sep 25, 1995
Sold by
Johnson Eunice M
Bought by
Kaliff Wayne C and Kaliff Mary E
Home Financials for this Owner
Home Financials are based on the most recent Mortgage that was taken out on this home.
Original Mortgage
$154,704
Interest Rate
7.97%
Mortgage Type
FHA
Purchase Details
Closed on
Mar 9, 1994
Sold by
Kennedy Lorraine Naomi
Bought by
Kennedy Lorraine Naomi
Purchase Details
Closed on
Apr 8, 1983
Create a Home Valuation Report for This Property
The Home Valuation Report is an in-depth analysis detailing your home's value as well as a comparison with similar homes in the area
Home Values in the Area
Average Home Value in this Area
Purchase History
| Date | Buyer | Sale Price | Title Company |
|---|---|---|---|
| Kaliff Wayne | -- | Amrock Llc | |
| Kaliff Wayne | -- | Amrock Llc | |
| Kaliff Wayne | -- | None Available | |
| Kaliff Wayne C | $158,000 | First American Title Co | |
| Kennedy Lorraine Naomi | -- | -- | |
| -- | $105,000 | -- |
Source: Public Records
Mortgage History
| Date | Status | Borrower | Loan Amount |
|---|---|---|---|
| Open | Kaliff Wayne | $365,700 | |
| Closed | Kaliff Wayne C | $154,704 |
Source: Public Records
Tax History Compared to Growth
Tax History
| Year | Tax Paid | Tax Assessment Tax Assessment Total Assessment is a certain percentage of the fair market value that is determined by local assessors to be the total taxable value of land and additions on the property. | Land | Improvement |
|---|---|---|---|---|
| 2025 | $3,109 | $262,445 | $136,329 | $126,116 |
| 2024 | $3,109 | $257,300 | $133,656 | $123,644 |
| 2023 | $3,038 | $252,256 | $131,036 | $121,220 |
| 2022 | $2,956 | $247,311 | $128,467 | $118,844 |
| 2021 | $2,934 | $242,463 | $125,949 | $116,514 |
| 2020 | $2,898 | $239,978 | $124,658 | $115,320 |
| 2019 | $2,845 | $235,273 | $122,214 | $113,059 |
| 2018 | $6,618 | $230,661 | $119,818 | $110,843 |
| 2017 | $81 | $226,139 | $117,469 | $108,670 |
| 2016 | $2,551 | $221,706 | $115,166 | $106,540 |
| 2015 | $2,512 | $218,377 | $113,437 | $104,940 |
| 2014 | $2,472 | $214,100 | $111,215 | $102,885 |
Source: Public Records
Map
Nearby Homes
- 4772 Mount Gaywas Dr
- 5061 Canosa Ave
- 4575 Chateau Dr
- 4915 Mount Gaywas Dr
- 4716 Mount Cervin Dr
- 5113 Bellvale Ave
- 4781 Boise Ave
- 4472 Mount Lindsey Ave
- 4979 Acuna St
- 4813 Boise Ave
- 4972 Mount Elbrus Dr
- 5252 Balboa Arms Dr Unit 180
- 5252 Balboa Arms Dr Unit 171
- 4527 Chinook Ct
- 5404 Balboa Arms Dr Unit 461
- 5402 Balboa Arms Dr Unit 345
- 5124 Acuna St
- 4501 Bannock Ave
- 4827 Rushden Ave
- 4509 Manitou Way
- 4827 Mount la Platta Dr
- 4851 Mount la Platta Dr
- 4812 Mount la Palma Dr
- 4822 Mount la Palma Dr
- 4815 Mount la Platta Dr
- 4863 Mount la Platta Dr
- 4802 Mount la Palma Dr
- 4832 Mount la Palma Dr
- 4828 Mount la Platta Dr
- 4840 Mount la Platta Dr
- 4801 Mount la Platta Dr
- 4875 Mount la Platta Dr
- 4852 Mount la Platta Dr
- 4816 Mount la Platta Dr
- 4792 Mount la Palma Dr
- 4842 Mount la Palma Dr
- 4551 Mount la Platta Place
- 4551 Mount La Plata Place
- 4781 Mount la Platta Dr
- 4909 Mount la Platta Dr