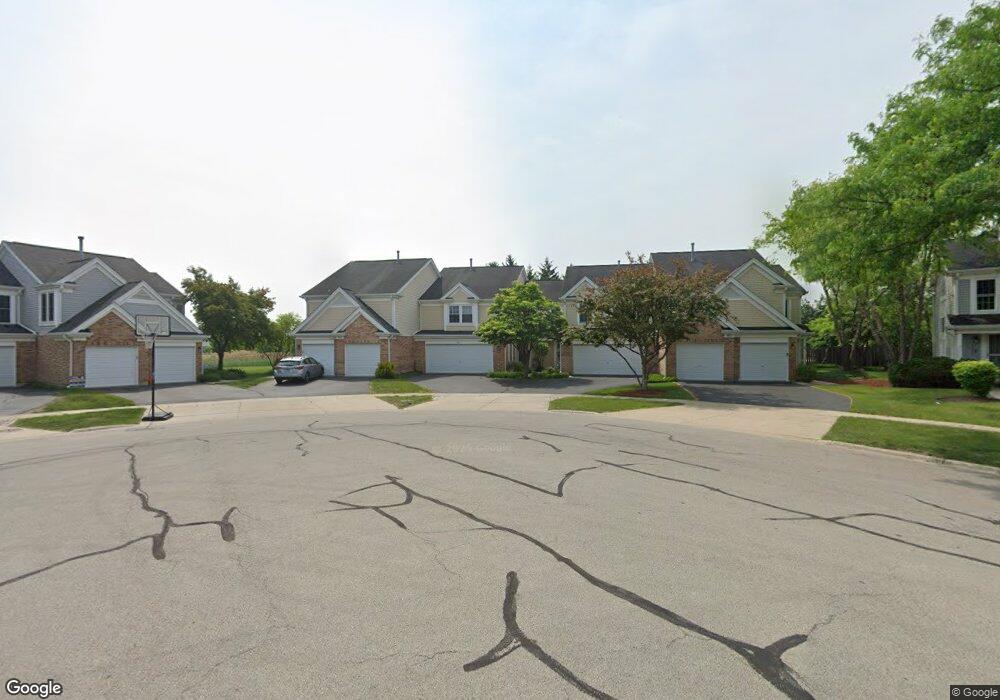
4841 Turnberry Dr Hoffman Estates, IL 60010
South Ridge NeighborhoodEstimated Value: $371,000 - $416,000
2
Beds
3
Baths
2,141
Sq Ft
$183/Sq Ft
Est. Value
About This Home
This home is located at 4841 Turnberry Dr, Hoffman Estates, IL 60010 and is currently estimated at $391,568, approximately $182 per square foot. 4841 Turnberry Dr is a home located in Cook County with nearby schools including Thomas Jefferson Elementary School, Marion Jordan Elementary School, and William Fremd High School.
Ownership History
Date
Name
Owned For
Owner Type
Purchase Details
Closed on
Jul 17, 2003
Sold by
Cendant Mobility Financial Corp
Bought by
Lee Sunny
Current Estimated Value
Home Financials for this Owner
Home Financials are based on the most recent Mortgage that was taken out on this home.
Original Mortgage
$180,000
Interest Rate
6.4%
Mortgage Type
Unknown
Purchase Details
Closed on
Jun 28, 2003
Sold by
Williams Robert J and Congiusti Lizbeth M
Bought by
Cendant Mobility Financial Corp
Home Financials for this Owner
Home Financials are based on the most recent Mortgage that was taken out on this home.
Original Mortgage
$180,000
Interest Rate
6.4%
Mortgage Type
Unknown
Purchase Details
Closed on
Apr 15, 1995
Sold by
Beverly Trust Company
Bought by
Williams Robert J and Congiusti Lizbeth M
Home Financials for this Owner
Home Financials are based on the most recent Mortgage that was taken out on this home.
Original Mortgage
$100,000
Interest Rate
7.87%
Create a Home Valuation Report for This Property
The Home Valuation Report is an in-depth analysis detailing your home's value as well as a comparison with similar homes in the area
Home Values in the Area
Average Home Value in this Area
Purchase History
| Date | Buyer | Sale Price | Title Company |
|---|---|---|---|
| Lee Sunny | $236,000 | Burnet Title Llc | |
| Cendant Mobility Financial Corp | $236,000 | Burnet Title Llc | |
| Williams Robert J | $167,500 | -- |
Source: Public Records
Mortgage History
| Date | Status | Borrower | Loan Amount |
|---|---|---|---|
| Previous Owner | Lee Sunny | $180,000 | |
| Previous Owner | Williams Robert J | $100,000 |
Source: Public Records
Tax History
| Year | Tax Paid | Tax Assessment Tax Assessment Total Assessment is a certain percentage of the fair market value that is determined by local assessors to be the total taxable value of land and additions on the property. | Land | Improvement |
|---|---|---|---|---|
| 2025 | $7,517 | $36,000 | $4,659 | $31,341 |
| 2024 | $7,517 | $27,834 | $5,000 | $22,834 |
| 2023 | $7,234 | $27,834 | $5,000 | $22,834 |
| 2022 | $7,234 | $27,834 | $5,000 | $22,834 |
| 2021 | $6,454 | $22,603 | $1,820 | $20,783 |
| 2020 | $6,386 | $22,603 | $1,820 | $20,783 |
| 2019 | $6,322 | $25,059 | $1,820 | $23,239 |
| 2018 | $6,347 | $23,469 | $1,674 | $21,795 |
| 2017 | $7,844 | $28,605 | $1,674 | $26,931 |
| 2016 | $7,534 | $28,605 | $1,674 | $26,931 |
| 2015 | $6,849 | $24,659 | $1,528 | $23,131 |
| 2014 | $6,736 | $24,659 | $1,528 | $23,131 |
| 2013 | $5,989 | $24,659 | $1,528 | $23,131 |
Source: Public Records
Map
Nearby Homes
- 1280 Clover Ln
- 1281 Old Timber Ct
- 4620 Olmstead Dr
- 4791 Amber Cir
- 1404 W Sapphire Dr
- 5083 Chambers Dr
- 1210 Downing Dr
- 4475 Olmstead Dr
- 4480 Thornbark Dr
- 4485 Bayside Cir
- 1690 Cape Breton Ct
- 775 Summer Isle Ln
- 940 Freeman Rd
- 4175 Victoria Dr
- 2204 Shetland Rd
- 61 E Palatine Rd
- 217 Haman Rd
- 61 E Rd
- 61 E Rd
- 61 E Palatine #4 Rd
- 4839 Turnberry Dr
- 4843 Turnberry Dr
- 4837 Turnberry Dr
- 4853 Turnberry Dr
- 4855 Turnberry Dr
- 4825 Turnberry Dr
- 4857 Turnberry Dr
- 4823 Turnberry Dr
- 4859 Turnberry Dr
- 4869 Turnberry Dr
- 4821 Turnberry Dr
- 4871 Turnberry Dr
- 4872 Turnberry Dr
- 4819 Turnberry Dr
- 4873 Turnberry Dr
- 4874 Turnberry Dr
- 4809 Turnberry Dr
- 4876 Turnberry Dr
- 4807 Turnberry Dr
- 4885 Turnberry Dr
Your Personal Tour Guide
Ask me questions while you tour the home.