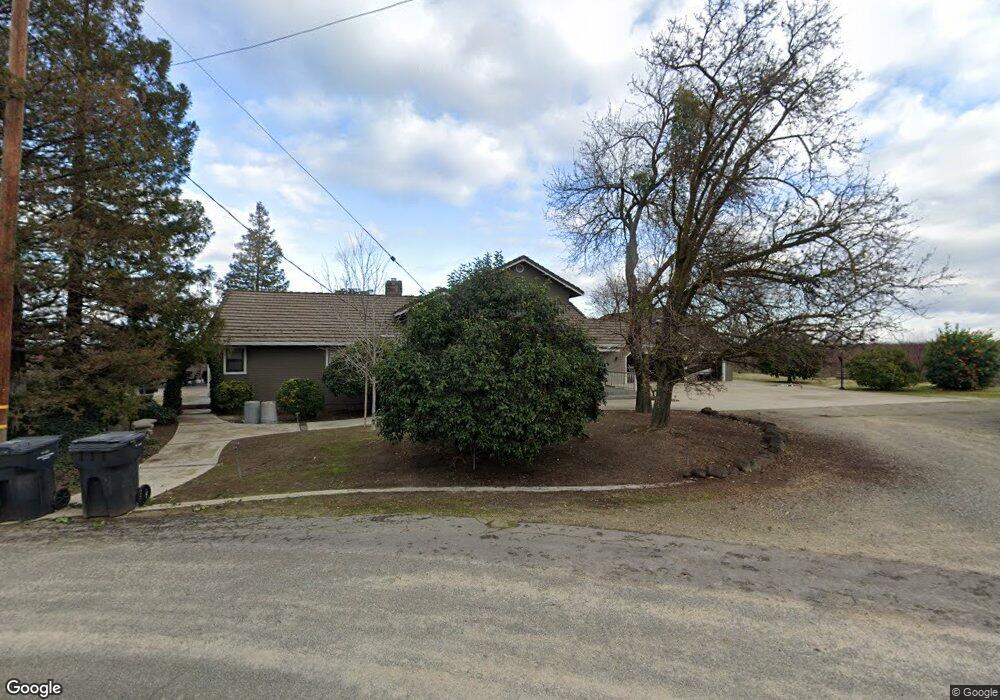
4842 Aldrich Rd Hughson, CA 95326
Estimated Value: $481,000 - $1,575,000
3
Beds
2
Baths
2,521
Sq Ft
$374/Sq Ft
Est. Value
About This Home
This home is located at 4842 Aldrich Rd, Hughson, CA 95326 and is currently estimated at $943,061, approximately $374 per square foot. 4842 Aldrich Rd is a home located in Stanislaus County with nearby schools including Hughson Elementary School, Fox Road Elementary School, and Emilie J. Ross Middle School.
Ownership History
Date
Name
Owned For
Owner Type
Purchase Details
Closed on
Jun 24, 1997
Sold by
Robinson Maynard G
Bought by
Lesan R Ken and Lesan Rita J
Current Estimated Value
Home Financials for this Owner
Home Financials are based on the most recent Mortgage that was taken out on this home.
Original Mortgage
$175,000
Outstanding Balance
$24,719
Interest Rate
7.83%
Estimated Equity
$918,342
Purchase Details
Closed on
Apr 8, 1995
Sold by
Deaver Beth E
Bought by
Robinson Maynard G and Watanabe Carol M
Home Financials for this Owner
Home Financials are based on the most recent Mortgage that was taken out on this home.
Original Mortgage
$216,000
Interest Rate
8.6%
Purchase Details
Closed on
Nov 9, 1994
Sold by
Deaver Beth E
Bought by
Deaver Beth E
Purchase Details
Closed on
Jan 5, 1994
Sold by
Deaver Michael W
Bought by
Deaver Beth E
Create a Home Valuation Report for This Property
The Home Valuation Report is an in-depth analysis detailing your home's value as well as a comparison with similar homes in the area
Home Values in the Area
Average Home Value in this Area
Purchase History
| Date | Buyer | Sale Price | Title Company |
|---|---|---|---|
| Lesan R Ken | $250,000 | Chicago Title Co | |
| Robinson Maynard G | $240,000 | Chicago Title Company | |
| Deaver Beth E | -- | Chicago Title Company | |
| Little J D | $119,000 | Chicago Title Company | |
| Deaver Beth E | -- | -- |
Source: Public Records
Mortgage History
| Date | Status | Borrower | Loan Amount |
|---|---|---|---|
| Open | Lesan R Ken | $175,000 | |
| Previous Owner | Robinson Maynard G | $216,000 |
Source: Public Records
Tax History Compared to Growth
Tax History
| Year | Tax Paid | Tax Assessment Tax Assessment Total Assessment is a certain percentage of the fair market value that is determined by local assessors to be the total taxable value of land and additions on the property. | Land | Improvement |
|---|---|---|---|---|
| 2025 | $4,520 | $399,169 | $151,680 | $247,489 |
| 2024 | $4,241 | $391,343 | $148,706 | $242,637 |
| 2023 | $4,142 | $383,671 | $145,791 | $237,880 |
| 2022 | $4,077 | $376,149 | $142,933 | $233,216 |
| 2021 | $3,998 | $368,775 | $140,131 | $228,644 |
| 2020 | $3,939 | $364,995 | $138,695 | $226,300 |
| 2019 | $3,899 | $357,839 | $135,976 | $221,863 |
| 2018 | $3,782 | $350,823 | $133,310 | $217,513 |
| 2017 | $3,814 | $343,946 | $130,697 | $213,249 |
| 2016 | $3,595 | $337,203 | $128,135 | $209,068 |
| 2015 | $3,536 | $332,139 | $126,211 | $205,928 |
| 2014 | $3,491 | $325,634 | $123,739 | $201,895 |
Source: Public Records
Map
Nearby Homes
- 4519 Aldrich Rd
- 7620 E Grayson Rd
- 5900 Geer Rd
- 7731 E Keyes Rd
- 631 E Barnhart Rd
- 5333 Geer Rd
- 4801 S Sperry Rd
- 2224 Province Place
- 4460 Mountain View Rd
- 4638 Cherry Blossom Ln
- 7306 Elm St
- 342 Sunnyhill Dr
- 924 Dancer Way
- 7606 Locust St
- 2318 7th St
- 715 W Taylor Rd
- 624 Summerton Ln
- 2301 5th St
- 2142 7th St
- 4310 Purple Sage Ln
- 4855 Aldrich Rd
- 4737 Aldrich Rd
- 4700 Aldrich Rd
- 4619 Aldrich Rd
- 4618 Aldrich Rd
- 4742 Santa fe Ave
- 4537 Aldrich Rd
- 4930 Geer Rd
- 8354 Redwood Rd
- 8443 Bigelow Rd
- 8336 Redwood Rd
- 8254 Redwood Rd
- 8240 Redwood Rd
- 4406 Aldrich Rd
- 8333 Bigelow Rd
- 8301 Bigelow Rd
- 4831 Berkeley Rd
- 4833 Berkeley Rd
- 4625 Berkeley Rd
- 4842 Berkeley Rd