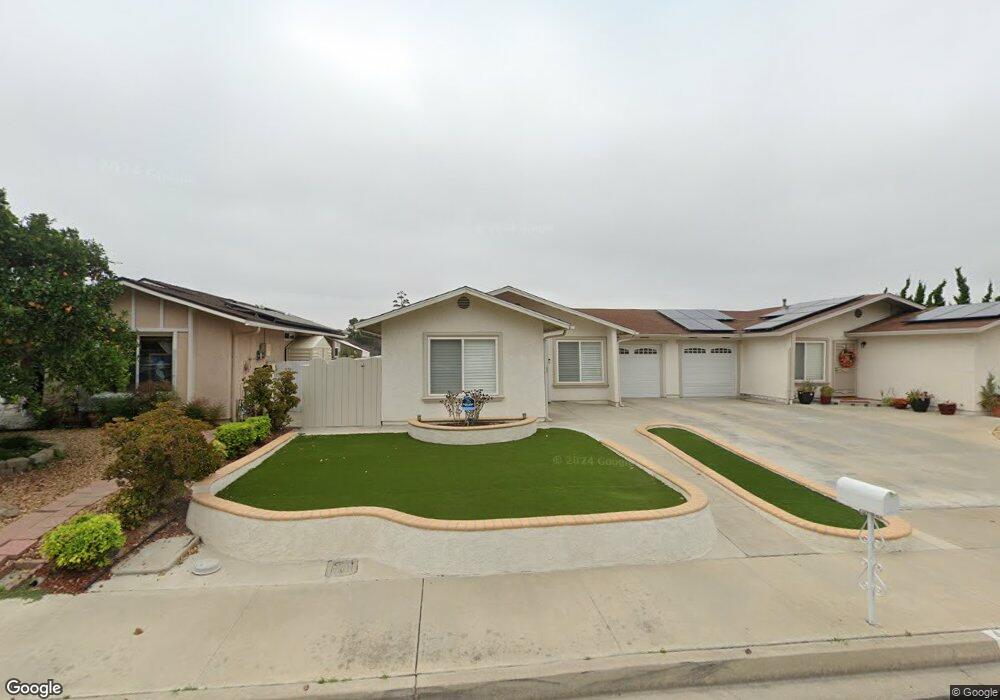
4842 Northerly St Oceanside, CA 92056
Peacock NeighborhoodEstimated Value: $593,000 - $703,000
2
Beds
1
Bath
834
Sq Ft
$777/Sq Ft
Est. Value
About This Home
This home is located at 4842 Northerly St, Oceanside, CA 92056 and is currently estimated at $648,258, approximately $777 per square foot. 4842 Northerly St is a home located in San Diego County with nearby schools including Empresa Elementary School, Roosevelt Middle School, and Vista High School.
Ownership History
Date
Name
Owned For
Owner Type
Purchase Details
Closed on
Jul 5, 2021
Sold by
Upton Georgia A and Upton Georgia Ann
Bought by
Kramsky Michael A and Michael A Kramsky Trust
Current Estimated Value
Home Financials for this Owner
Home Financials are based on the most recent Mortgage that was taken out on this home.
Original Mortgage
$400,000
Outstanding Balance
$363,270
Interest Rate
2.96%
Mortgage Type
New Conventional
Estimated Equity
$284,988
Purchase Details
Closed on
Jan 28, 2002
Sold by
Franken Samuel V and Franken Eileen D
Bought by
Upton Georgia A
Purchase Details
Closed on
Dec 18, 1995
Sold by
Norwest Mtg Inc
Bought by
Federal National Mortgage Association
Purchase Details
Closed on
Nov 16, 1995
Sold by
Murphy Janet M
Bought by
Norwest Mtg Inc
Purchase Details
Closed on
Aug 21, 1995
Sold by
Federal National Mortgage Association
Bought by
Franken Samuel V and Franken Eileen B
Purchase Details
Closed on
Jul 25, 1990
Create a Home Valuation Report for This Property
The Home Valuation Report is an in-depth analysis detailing your home's value as well as a comparison with similar homes in the area
Home Values in the Area
Average Home Value in this Area
Purchase History
| Date | Buyer | Sale Price | Title Company |
|---|---|---|---|
| Kramsky Michael A | $600,000 | Equity Title San Diego | |
| Upton Georgia A | $145,000 | Commonwealth Land Title | |
| Federal National Mortgage Association | -- | American Title Ins Co | |
| Norwest Mtg Inc | $71,000 | First American Title Ins Co | |
| Franken Samuel V | $74,000 | American Title Ins Co | |
| -- | $107,000 | -- |
Source: Public Records
Mortgage History
| Date | Status | Borrower | Loan Amount |
|---|---|---|---|
| Open | Kramsky Michael A | $400,000 |
Source: Public Records
Tax History Compared to Growth
Tax History
| Year | Tax Paid | Tax Assessment Tax Assessment Total Assessment is a certain percentage of the fair market value that is determined by local assessors to be the total taxable value of land and additions on the property. | Land | Improvement |
|---|---|---|---|---|
| 2025 | $6,774 | $636,724 | $498,767 | $137,957 |
| 2024 | $6,774 | $624,240 | $488,988 | $135,252 |
| 2023 | $6,686 | $612,000 | $479,400 | $132,600 |
| 2022 | $6,669 | $600,000 | $470,000 | $130,000 |
| 2021 | $2,237 | $197,877 | $102,350 | $95,527 |
| 2020 | $2,230 | $195,849 | $101,301 | $94,548 |
| 2019 | $2,198 | $192,010 | $99,315 | $92,695 |
| 2018 | $2,091 | $188,246 | $97,368 | $90,878 |
| 2017 | $2,053 | $184,556 | $95,459 | $89,097 |
| 2016 | $2,004 | $180,938 | $93,588 | $87,350 |
| 2015 | $1,997 | $178,221 | $92,183 | $86,038 |
| 2014 | $1,949 | $174,731 | $90,378 | $84,353 |
Source: Public Records
Map
Nearby Homes
- 1366 Panorama Ridge Rd
- 1385 Temple Heights Dr
- 1426 Westwood Place
- 1463 Westmore Place
- 1441 Peacock Blvd
- 4867 Meadowbrook Dr
- 5014 Palmera Dr
- 5141 Palmera Dr
- 1460 Highridge Dr
- 1359 Cottonwood Dr
- 1523 Temple Heights Dr
- 1314 Woodview Dr
- 1529 Temple Heights Dr
- 5236 Palmera Dr
- 1208 Darwin Dr
- 1328 Woodhaven Dr
- 4712 Rim Rock Rd
- 1609 Fig Tree Way
- 1216 Woodview Dr
- 4708 Sunrise Ridge
- 4844 Northerly St
- 4838 Northerly St Unit 3
- 4846 Northerly St
- 4836 Northerly St
- 4834 Northerly St
- 4848 Northerly St
- 4843 Northerly St
- 4841 Northerly St
- 4847 Northerly St
- 4832 Northerly St
- 4837 Northerly St
- 4835 Northerly St
- 4852 Northerly St
- 4830 Northerly St
- 4833 Northerly St
- 4849 Northerly St
- 4853 Northerly St
- 4828 Northerly St
- 4831 Northerly St
- 4829 Northerly St