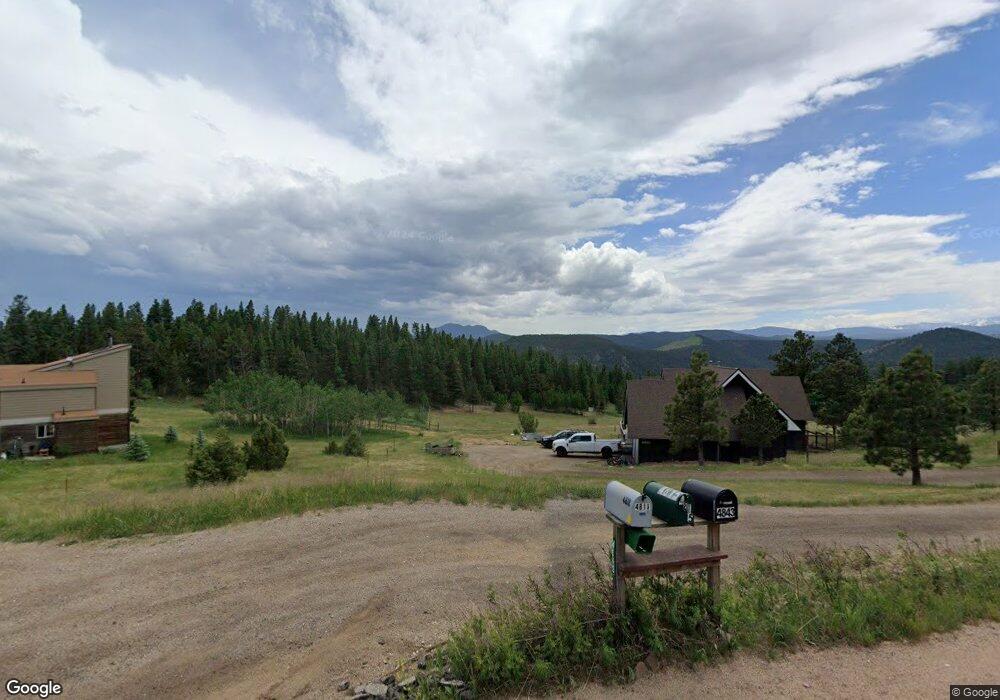
4843 Sugarloaf Rd Boulder, CO 80302
Sugarloaf NeighborhoodEstimated Value: $603,375 - $809,000
1
Bed
1
Bath
816
Sq Ft
$827/Sq Ft
Est. Value
About This Home
This home is located at 4843 Sugarloaf Rd, Boulder, CO 80302 and is currently estimated at $674,458, approximately $826 per square foot. 4843 Sugarloaf Rd is a home located in Boulder County with nearby schools including Flatirons Elementary School, Casey Middle School, and Boulder High School.
Ownership History
Date
Name
Owned For
Owner Type
Purchase Details
Closed on
Aug 4, 2015
Sold by
Bush David J and Bush David John
Bought by
Bush David J
Current Estimated Value
Home Financials for this Owner
Home Financials are based on the most recent Mortgage that was taken out on this home.
Original Mortgage
$660,000
Outstanding Balance
$498,104
Interest Rate
2.89%
Mortgage Type
Reverse Mortgage Home Equity Conversion Mortgage
Estimated Equity
$176,354
Purchase Details
Closed on
Oct 21, 2014
Sold by
The Rocky Mountain Conference Of Seventh
Bought by
Priscilla M Bush Revocable Trust
Purchase Details
Closed on
Jun 3, 2014
Sold by
Chapman Gerald A and Estate Of Priscilla M Bush
Bought by
The Rocky Mountain Conference Of Seventh and Priscilla M Bush Revocable Trust
Purchase Details
Closed on
Dec 26, 1990
Sold by
Bush Priscilla M
Bought by
The Seventh Day Adventist Assn
Purchase Details
Closed on
Aug 19, 1987
Bought by
Bush David John
Create a Home Valuation Report for This Property
The Home Valuation Report is an in-depth analysis detailing your home's value as well as a comparison with similar homes in the area
Home Values in the Area
Average Home Value in this Area
Purchase History
| Date | Buyer | Sale Price | Title Company |
|---|---|---|---|
| Bush David J | -- | None Available | |
| Priscilla M Bush Revocable Trust | -- | None Available | |
| The Rocky Mountain Conference Of Seventh | -- | None Available | |
| The Seventh Day Adventist Assn | -- | -- | |
| The Seventh Day Adventist Assn | -- | -- | |
| Bush David John | -- | -- | |
| Bush David John | -- | -- |
Source: Public Records
Mortgage History
| Date | Status | Borrower | Loan Amount |
|---|---|---|---|
| Open | Bush David J | $660,000 |
Source: Public Records
Tax History
| Year | Tax Paid | Tax Assessment Tax Assessment Total Assessment is a certain percentage of the fair market value that is determined by local assessors to be the total taxable value of land and additions on the property. | Land | Improvement |
|---|---|---|---|---|
| 2025 | $2,400 | $35,801 | $20,688 | $15,113 |
| 2024 | $2,400 | $35,801 | $20,688 | $15,113 |
| 2023 | $2,357 | $28,133 | $20,006 | $11,812 |
| 2022 | $2,821 | $31,247 | $16,965 | $14,282 |
| 2021 | $2,673 | $32,146 | $17,453 | $14,693 |
| 2020 | $2,334 | $27,742 | $16,731 | $11,011 |
| 2019 | $2,297 | $27,742 | $16,731 | $11,011 |
| 2018 | $2,188 | $26,431 | $11,160 | $15,271 |
| 2017 | $2,124 | $29,221 | $12,338 | $16,883 |
| 2016 | $1,846 | $22,288 | $13,373 | $8,915 |
| 2015 | $1,740 | $24,207 | $6,846 | $17,361 |
| 2014 | $2,029 | $24,207 | $6,846 | $17,361 |
Source: Public Records
Map
Nearby Homes
- 5566 Sugarloaf Rd
- 0 Good Friday Rd
- 136 Old Post Office Rd
- 730 Lost Angel Rd
- 6055 Fourmile Canyon Dr
- 7893 Fourmile Canyon Dr
- 718 Emerson Gulch Rd
- 00 County Rd 89 Unit 237
- 300 Shining Star Trail
- 300 Shining Star Trail Unit A
- 1213 Primos Rd
- 1215 Primos Rd
- 208 Wild Tiger Rd
- 31 Wild Tiger Ln
- 280 Rim Rd
- 6122 Fourmile Canyon Dr
- 0 Gold Trail
- 6112 Fourmile Canyon Dr
- 35112 Boulder Canyon Dr
- 815 Cougar Run
- 4841 Sugarloaf Rd
- 4809 Sugarloaf Rd
- 5055 Sugarloaf Rd
- 4815 Sugarloaf Rd
- 5139 Sugarloaf Rd
- 4811 Sugarloaf Rd
- 5223 Sugarloaf Rd
- 4988 Sugarloaf Rd
- 4747 Sugarloaf Rd
- 1785 Old Townsite Rd
- 194 S Peak Rd
- 4872 Sugarloaf Rd
- 4866 Sugarloaf Rd
- 4800 Sugarloaf Rd
- 5152 Sugarloaf Rd
- 250 S Peak Rd
- 284 S Peak Rd
- 47 S Peak Trail
- 47 S Peak Trail
- 76 S Peak Trail
Your Personal Tour Guide
Ask me questions while you tour the home.