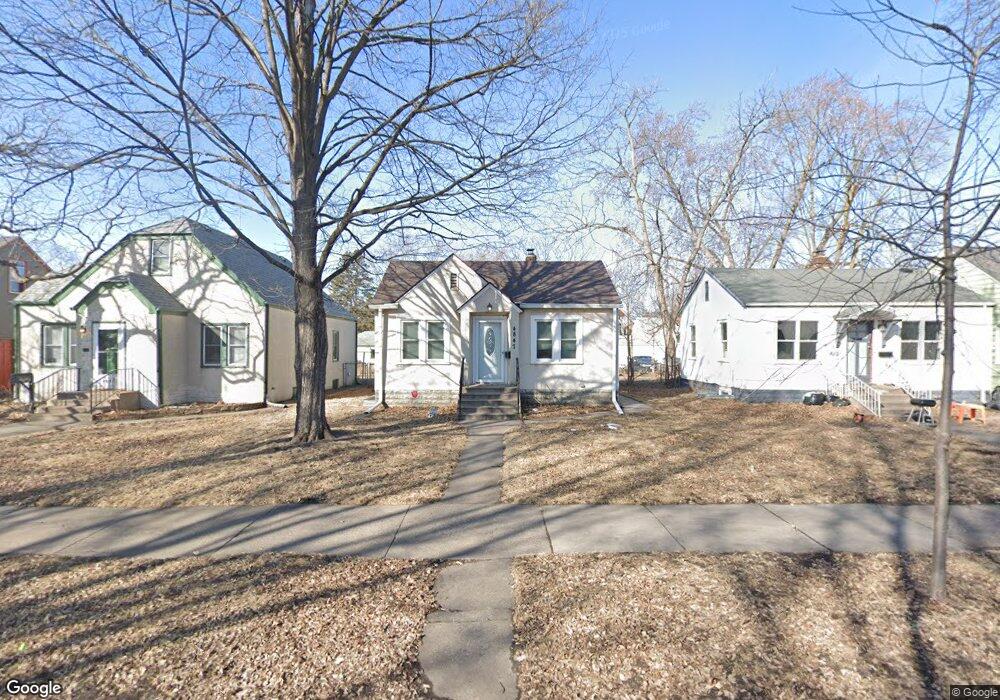
4847 4847 N Dupont-Avenue-n Minneapolis, MN 55412
Lind-Bohanon NeighborhoodEstimated Value: $231,000 - $273,146
3
Beds
1
Bath
780
Sq Ft
$316/Sq Ft
Est. Value
About This Home
This home is located at 4847 4847 N Dupont-Avenue-n, Minneapolis, MN 55412 and is currently estimated at $246,287, approximately $315 per square foot. 4847 4847 N Dupont-Avenue-n is a home located in Hennepin County with nearby schools including Jenny Lind Elementary School, Olson Middle School, and Bright Water MontessoriSchool.
Ownership History
Date
Name
Owned For
Owner Type
Purchase Details
Closed on
Oct 31, 2019
Sold by
Flicker Kyle J
Bought by
Castro Antonio J
Current Estimated Value
Home Financials for this Owner
Home Financials are based on the most recent Mortgage that was taken out on this home.
Original Mortgage
$184,320
Outstanding Balance
$162,476
Interest Rate
3.7%
Mortgage Type
VA
Estimated Equity
$83,811
Purchase Details
Closed on
Jun 20, 2014
Sold by
Amburg Inc
Bought by
Flicker Kyle J
Home Financials for this Owner
Home Financials are based on the most recent Mortgage that was taken out on this home.
Original Mortgage
$100,000
Interest Rate
4.13%
Mortgage Type
New Conventional
Purchase Details
Closed on
Aug 23, 2013
Sold by
Bank Of America Na
Bought by
Amburg Inc
Purchase Details
Closed on
Oct 5, 2012
Sold by
Mavis Robert W
Bought by
Bank Of America Na
Create a Home Valuation Report for This Property
The Home Valuation Report is an in-depth analysis detailing your home's value as well as a comparison with similar homes in the area
Home Values in the Area
Average Home Value in this Area
Purchase History
| Date | Buyer | Sale Price | Title Company |
|---|---|---|---|
| Castro Antonio J | $180,000 | Sherburne Cnty Abstract & Tt | |
| Flicker Kyle J | $130,000 | Liberty Title Inc | |
| Amburg Inc | $42,000 | None Available | |
| Bank Of America Na | $170,589 | -- |
Source: Public Records
Mortgage History
| Date | Status | Borrower | Loan Amount |
|---|---|---|---|
| Open | Castro Antonio J | $184,320 | |
| Previous Owner | Flicker Kyle J | $100,000 |
Source: Public Records
Tax History Compared to Growth
Tax History
| Year | Tax Paid | Tax Assessment Tax Assessment Total Assessment is a certain percentage of the fair market value that is determined by local assessors to be the total taxable value of land and additions on the property. | Land | Improvement |
|---|---|---|---|---|
| 2024 | $3,650 | $251,000 | $37,000 | $214,000 |
| 2023 | $3,476 | $260,000 | $34,000 | $226,000 |
| 2022 | $2,892 | $236,000 | $31,000 | $205,000 |
| 2021 | $2,368 | $207,000 | $11,000 | $196,000 |
| 2020 | $2,342 | $194,500 | $19,400 | $175,100 |
| 2019 | $2,102 | $180,000 | $13,800 | $166,200 |
| 2018 | $1,695 | $160,500 | $13,800 | $146,700 |
| 2017 | $1,809 | $117,500 | $12,500 | $105,000 |
| 2016 | $1,678 | $105,500 | $12,500 | $93,000 |
| 2015 | $1,261 | $75,500 | $12,500 | $63,000 |
| 2014 | -- | $74,000 | $12,500 | $61,500 |
Source: Public Records
Map
Nearby Homes
- 4701 Dupont Ave N
- 4643 Emerson Ave N
- 4933 Fremont Ave N
- 4635 Emerson Ave N
- 4715 Camden Ave N
- 5050 Emerson Ave N
- 4746 N 6th St
- 4543 Aldrich Ave N
- 5053 Girard Ave N
- 4631 Lyndale Ave N
- 5037 Camden Ave N
- 4502 Colfax Ave N
- 5121 Aldrich Ave N
- 5118 James Ave N
- 5200 Aldrich Ave N
- 4918 Morgan Ave N
- 4334 Fremont Ave N
- 5238 Fremont Ave N
- 4344 Irving Ave N
- 5239 N 6th St
- 4847 Dupont Ave N
- 4843 Dupont Ave N
- 4851 Dupont Ave N
- 4839 Dupont Ave N
- 4855 Dupont Ave N
- 4835 Dupont Ave N
- 4859 Dupont Ave N
- 4846 4846 Emerson Ave N
- 4846 Emerson Ave N
- 4842 Emerson Ave N
- 4850 Emerson Ave N
- 4831 Dupont Ave N
- 4838 Emerson Ave N
- 4854 Emerson Ave N
- 4834 Emerson Ave N
- 4858 Emerson Ave N
- 4846 Dupont Ave N
- 4850 Dupont Ave N
- 4842 Dupont Ave N
- 4827 Dupont Ave N