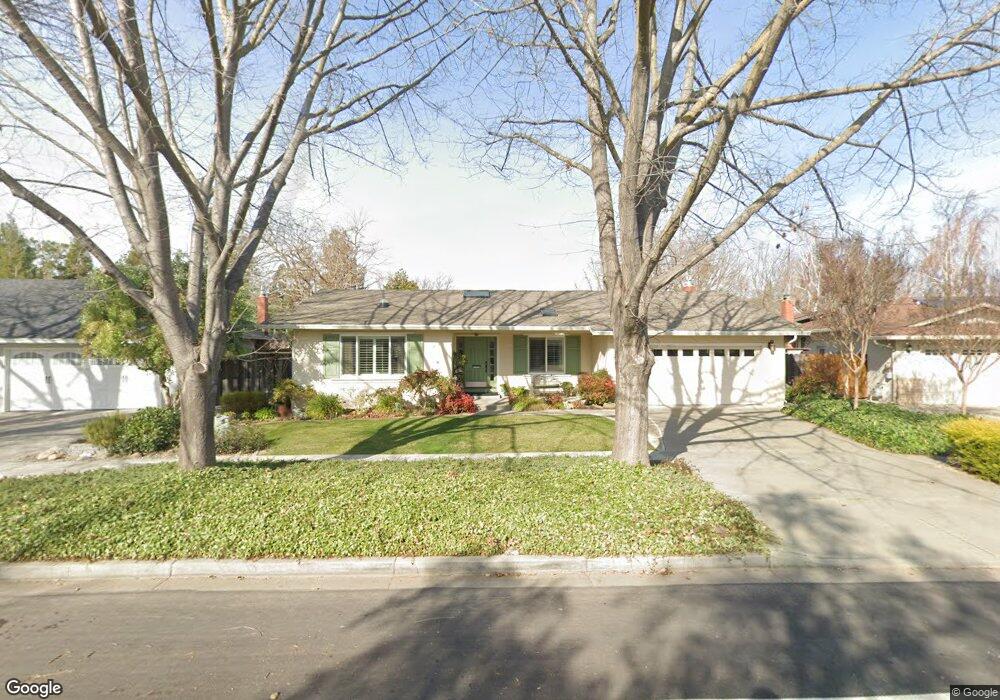
4847 Del Valle Pkwy Pleasanton, CA 94566
Amador Valley NeighborhoodEstimated Value: $1,652,000 - $1,809,000
4
Beds
2
Baths
2,172
Sq Ft
$782/Sq Ft
Est. Value
About This Home
This home is located at 4847 Del Valle Pkwy, Pleasanton, CA 94566 and is currently estimated at $1,698,930, approximately $782 per square foot. 4847 Del Valle Pkwy is a home located in Alameda County with nearby schools including Walnut Grove Elementary School, Harvest Park Middle School, and Amador Valley High School.
Ownership History
Date
Name
Owned For
Owner Type
Purchase Details
Closed on
Nov 8, 2003
Sold by
Smith Thomas R and Smith Mary Jo
Bought by
Smith Thomas Robert and Smith Mary Jo
Current Estimated Value
Home Financials for this Owner
Home Financials are based on the most recent Mortgage that was taken out on this home.
Original Mortgage
$322,700
Interest Rate
5.94%
Mortgage Type
Balloon
Purchase Details
Closed on
Oct 24, 2003
Sold by
Boyd Teresa A and The Samuel & Teresa Boyd Livin
Bought by
Smith Thomas R and Smith Mary Jo
Home Financials for this Owner
Home Financials are based on the most recent Mortgage that was taken out on this home.
Original Mortgage
$322,700
Interest Rate
5.94%
Mortgage Type
Balloon
Purchase Details
Closed on
Aug 23, 2002
Sold by
Boyd Teresa A and Boyd Brian P
Bought by
Boyd Teresa A and The Samuel & Teresa Boyd Livin
Purchase Details
Closed on
May 25, 2001
Sold by
Boyd Samuel M and Boyd Teresa A
Bought by
Boyd Samuel M and Boyd Teresa A
Create a Home Valuation Report for This Property
The Home Valuation Report is an in-depth analysis detailing your home's value as well as a comparison with similar homes in the area
Home Values in the Area
Average Home Value in this Area
Purchase History
| Date | Buyer | Sale Price | Title Company |
|---|---|---|---|
| Smith Thomas Robert | -- | Fidelity National Title | |
| Smith Thomas R | $614,000 | Fidelity National Title Co | |
| Boyd Teresa A | -- | -- | |
| Boyd Samuel M | -- | -- | |
| Boyd Samuel M | -- | -- |
Source: Public Records
Mortgage History
| Date | Status | Borrower | Loan Amount |
|---|---|---|---|
| Closed | Smith Thomas R | $322,700 |
Source: Public Records
Tax History Compared to Growth
Tax History
| Year | Tax Paid | Tax Assessment Tax Assessment Total Assessment is a certain percentage of the fair market value that is determined by local assessors to be the total taxable value of land and additions on the property. | Land | Improvement |
|---|---|---|---|---|
| 2025 | $3,646 | $309,855 | $133,790 | $183,065 |
| 2024 | $3,646 | $303,643 | $131,167 | $179,476 |
| 2023 | $3,602 | $304,554 | $128,596 | $175,958 |
| 2022 | $3,413 | $291,584 | $126,075 | $172,509 |
| 2021 | $3,324 | $285,731 | $123,604 | $169,127 |
| 2020 | $3,281 | $289,731 | $122,337 | $167,394 |
| 2019 | $3,318 | $284,052 | $119,939 | $164,113 |
| 2018 | $3,250 | $278,483 | $117,588 | $160,895 |
| 2017 | $3,167 | $273,024 | $115,283 | $157,741 |
| 2016 | $2,918 | $267,673 | $113,023 | $154,650 |
| 2015 | $2,864 | $263,653 | $111,326 | $152,327 |
| 2014 | $2,912 | $258,490 | $109,146 | $149,344 |
Source: Public Records
Map
Nearby Homes
- 5041 Golden Rd
- 1253 Ridgewood Rd
- 1038 Division St
- 1550 Calle Enrique
- 4428 Del Valle Pkwy
- 5254 Ridgevale Way
- 519 Saint John St
- 5550 Black Ave
- 1834 Brooktree Way
- 1984 Brooktree Way
- 466 Rose Ave
- 4374 Valley Ave Unit D1
- 4171 School St
- 4655 Augustine St
- 2320 Sandpiper Way
- 4073 Stanley Blvd
- 141 Ray St
- 68 Peters Ave Unit 6
- 297 Del Valle Ct
- 2531 Willowren Way
- 4825 Del Valle Pkwy
- 4869 Del Valle Pkwy
- 1374 Harvest Rd
- 1352 Harvest Rd
- 1396 Harvest Rd
- 1330 Harvest Rd
- 4789 Del Valle Pkwy
- 1308 Harvest Rd
- 1041 Harvest Cir
- 4796 Del Valle Pkwy
- 1423 Parkview Ct
- 4767 Del Valle Pkwy
- 1296 Harvest Rd
- 1043 Harvest Cir
- 4774 Del Valle Pkwy
- 1308 Vailwood Ct
- 1420 Parkview Ct
- 1042 Harvest Cir
- 1455 Parkview Ct
- 1047 Harvest Cir