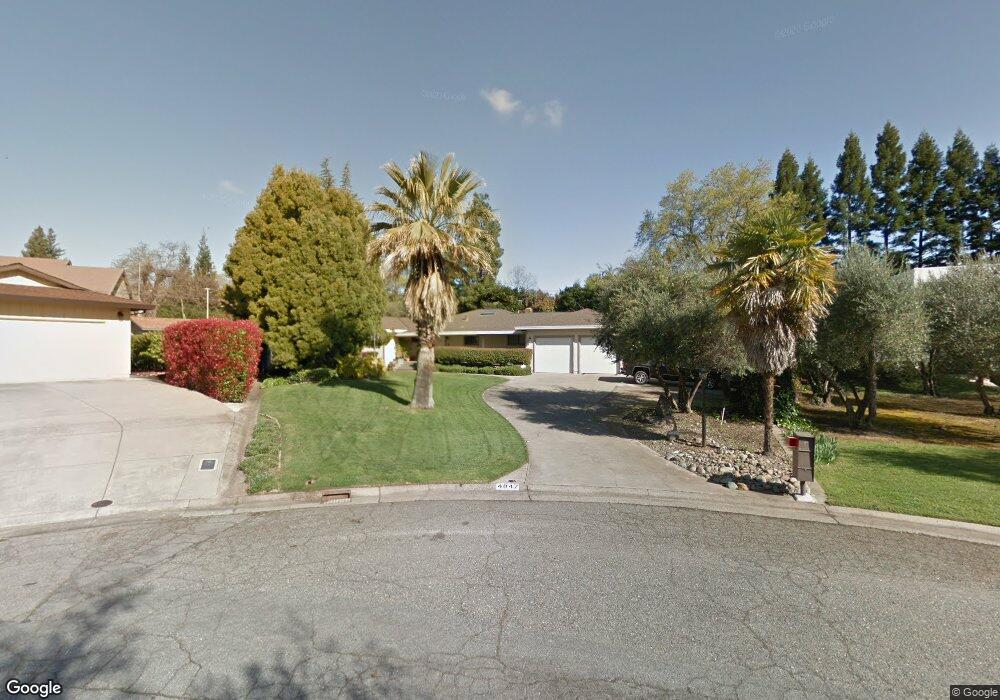
4847 Tommar Dr Fair Oaks, CA 95628
Estimated Value: $593,000 - $805,000
4
Beds
3
Baths
2,316
Sq Ft
$302/Sq Ft
Est. Value
About This Home
This home is located at 4847 Tommar Dr, Fair Oaks, CA 95628 and is currently estimated at $698,424, approximately $301 per square foot. 4847 Tommar Dr is a home located in Sacramento County with nearby schools including Northridge Elementary School, Andrew Carnegie Middle School, and Bella Vista High School.
Ownership History
Date
Name
Owned For
Owner Type
Purchase Details
Closed on
Aug 13, 2018
Sold by
Jones Theodore and Jones Izumi
Bought by
Jones Theodore and Jones Izumi
Current Estimated Value
Purchase Details
Closed on
Sep 3, 2002
Sold by
Va
Bought by
Jones Theodore and Jones Izumi
Home Financials for this Owner
Home Financials are based on the most recent Mortgage that was taken out on this home.
Original Mortgage
$280,000
Outstanding Balance
$117,392
Interest Rate
6.29%
Estimated Equity
$581,032
Purchase Details
Closed on
Apr 20, 1999
Sold by
L & H Homes Inc
Bought by
Va
Purchase Details
Closed on
Dec 4, 1998
Sold by
Clark Mackey James Thomas and Clark Carrie Ann
Bought by
L & H Homes Inc
Home Financials for this Owner
Home Financials are based on the most recent Mortgage that was taken out on this home.
Original Mortgage
$243,000
Interest Rate
6.86%
Mortgage Type
Seller Take Back
Create a Home Valuation Report for This Property
The Home Valuation Report is an in-depth analysis detailing your home's value as well as a comparison with similar homes in the area
Home Values in the Area
Average Home Value in this Area
Purchase History
| Date | Buyer | Sale Price | Title Company |
|---|---|---|---|
| Jones Theodore | -- | None Available | |
| Jones Theodore | -- | American Title Insurance Co | |
| Va | $262,500 | Chicago Title Co | |
| L & H Homes Inc | $249,000 | Chicago Title Co |
Source: Public Records
Mortgage History
| Date | Status | Borrower | Loan Amount |
|---|---|---|---|
| Open | Jones Theodore | $280,000 | |
| Previous Owner | L & H Homes Inc | $243,000 |
Source: Public Records
Tax History
| Year | Tax Paid | Tax Assessment Tax Assessment Total Assessment is a certain percentage of the fair market value that is determined by local assessors to be the total taxable value of land and additions on the property. | Land | Improvement |
|---|---|---|---|---|
| 2025 | $4,894 | $411,500 | $101,887 | $309,613 |
| 2024 | $4,894 | $403,433 | $99,890 | $303,543 |
| 2023 | $4,750 | $395,524 | $97,932 | $297,592 |
| 2022 | $4,731 | $387,769 | $96,012 | $291,757 |
| 2021 | $4,638 | $380,167 | $94,130 | $286,037 |
| 2020 | $4,571 | $376,270 | $93,165 | $283,105 |
| 2019 | $4,453 | $368,893 | $91,339 | $277,554 |
| 2018 | $4,354 | $361,661 | $89,549 | $272,112 |
| 2017 | $4,309 | $354,571 | $87,794 | $266,777 |
| 2016 | $4,025 | $347,620 | $86,073 | $261,547 |
| 2015 | $3,954 | $342,400 | $84,781 | $257,619 |
| 2014 | $3,870 | $335,694 | $83,121 | $252,573 |
Source: Public Records
Map
Nearby Homes
- 4814 Hardison Ct
- 11330 Fair Oaks Blvd Unit 102A
- 11330 Fair Oaks Blvd Unit 124B
- 11330 Fair Oaks Blvd Unit 208A
- 8057 Sunset Ave
- 8060 Sunset Ave
- 8023 Ridgeglen Way
- 4901 Livoti Ave
- 7973 Cavalli Way
- 8255 Oahu Dr
- 8004 Archer Ave
- 7948 Sunset Ave
- 5343 Maui Way
- 7912 Wildridge Dr
- 4939 Windsor Village Ln
- 5375 Terrace Oak Cir
- 7916 Laurelridge Ct
- 8112 Red Sherry Ln
- 8157 Winding Way
- 5106 Sunrise Hills Dr
- 4853 Tommar Dr
- 4841 Tommar Dr
- 1105 Kenny Rd
- 8140 E Carriage Ln
- 8108 Rockfield Ct
- 8136 E Carriage Ln
- 8137 E Carriage Ln
- 8116 Rockfield Ct
- 4835 Tommar Dr
- 4859 Tommar Dr
- 4945 Country View Ln
- 8100 Rockfield Ct
- 4852 Tommar Dr
- 4943 Country View Ln
- 8132 E Carriage Ln
- 8133 E Carriage Ln
- 4941 Country View Ln
- 4900 Richwood Ct
- 4939 Country View Ln
- 4910 Richwood Ct
Your Personal Tour Guide
Ask me questions while you tour the home.