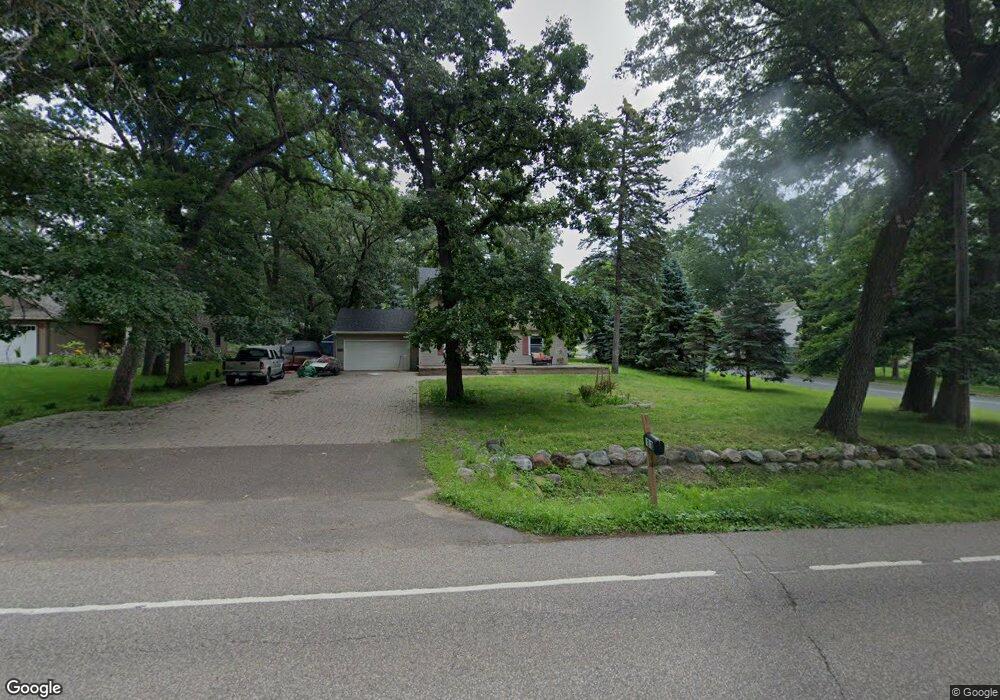
4848 Otter Lake Rd Saint Paul, MN 55110
Estimated Value: $360,000 - $433,000
3
Beds
2
Baths
1,815
Sq Ft
$216/Sq Ft
Est. Value
About This Home
This home is located at 4848 Otter Lake Rd, Saint Paul, MN 55110 and is currently estimated at $392,633, approximately $216 per square foot. 4848 Otter Lake Rd is a home located in Ramsey County with nearby schools including Birch Lake Elementary School, Central Middle School, and Frassati Catholic Academy.
Ownership History
Date
Name
Owned For
Owner Type
Purchase Details
Closed on
Jan 12, 2021
Sold by
Colestock Stephanie Ann
Bought by
Welskopt Timothy James and Coleetock Stephanie Ann
Current Estimated Value
Home Financials for this Owner
Home Financials are based on the most recent Mortgage that was taken out on this home.
Original Mortgage
$168,000
Outstanding Balance
$121,868
Interest Rate
2.33%
Mortgage Type
New Conventional
Estimated Equity
$270,765
Purchase Details
Closed on
Dec 23, 2016
Sold by
Colestock Stephanie Ann and Gerten Stephnie
Bought by
Colestock Stephanie Ann
Home Financials for this Owner
Home Financials are based on the most recent Mortgage that was taken out on this home.
Original Mortgage
$152,278
Interest Rate
4.03%
Mortgage Type
FHA
Purchase Details
Closed on
Jan 31, 2000
Sold by
Ek Charles and Ek Janet
Bought by
Quast Sean C
Create a Home Valuation Report for This Property
The Home Valuation Report is an in-depth analysis detailing your home's value as well as a comparison with similar homes in the area
Home Values in the Area
Average Home Value in this Area
Purchase History
| Date | Buyer | Sale Price | Title Company |
|---|---|---|---|
| Welskopt Timothy James | -- | Silk Abstract Company | |
| Colestock Stephanie Ann | -- | None Available | |
| Quast Sean C | $159,250 | -- |
Source: Public Records
Mortgage History
| Date | Status | Borrower | Loan Amount |
|---|---|---|---|
| Open | Welskopt Timothy James | $168,000 | |
| Closed | Colestock Stephanie Ann | $152,278 |
Source: Public Records
Tax History Compared to Growth
Tax History
| Year | Tax Paid | Tax Assessment Tax Assessment Total Assessment is a certain percentage of the fair market value that is determined by local assessors to be the total taxable value of land and additions on the property. | Land | Improvement |
|---|---|---|---|---|
| 2025 | $4,752 | $378,300 | $94,400 | $283,900 |
| 2023 | $4,752 | $363,100 | $94,400 | $268,700 |
| 2022 | $3,878 | $345,100 | $94,400 | $250,700 |
| 2021 | $3,718 | $297,200 | $94,400 | $202,800 |
| 2020 | $4,070 | $292,900 | $94,400 | $198,500 |
| 2019 | $3,646 | $299,100 | $94,400 | $204,700 |
| 2018 | $3,294 | $272,300 | $94,400 | $177,900 |
| 2017 | $3,026 | $269,900 | $94,400 | $175,500 |
| 2016 | $3,000 | $0 | $0 | $0 |
| 2015 | $2,770 | $233,100 | $88,500 | $144,600 |
| 2014 | $2,418 | $0 | $0 | $0 |
Source: Public Records
Map
Nearby Homes
- 4787 Otter Lake Rd
- 1770 5th St
- 1785 Thury Ct
- 4864 Woodcrest Rd
- 1744 Birch Lake Ave
- 4592 Carolyn Ln
- 5040 Woodcrest Rd
- 4969 Georgia Ln
- 1525 Pine Pointe
- 4545 Margaret St
- 4558 Margaret St
- 1905 Birch Lake Ave
- 4485 Margaret St
- 1917 Webber St
- 4987 Campbell Ave
- 5203 Latta St
- 1122 Iris Dr
- 1988 Florence St
- 5253 W Bald Eagle Blvd
- 5255 W Bald Eagle Blvd
- 4856 Otter Lake Rd
- 48XX Otter Lake Rd
- 1559 Quast Ct
- 1560 Quast Ct
- 1567 Quast Ct
- 1541 5th St
- 4833 Otter Lake Rd
- 1549 5th St
- 1568 Quast Ct
- 1557 5th St
- 4853 Otter Lake Rd
- 4870 Otter Lake Rd
- 4865 Otter Lake Rd
- 1565 5th St
- 4845 Otter Lake Rd
- 1575 Quast Ct
- 1583 Quast Ct
- 1576 Quast Ct
- 1573 5th St
- 4875 Otter Lake Rd