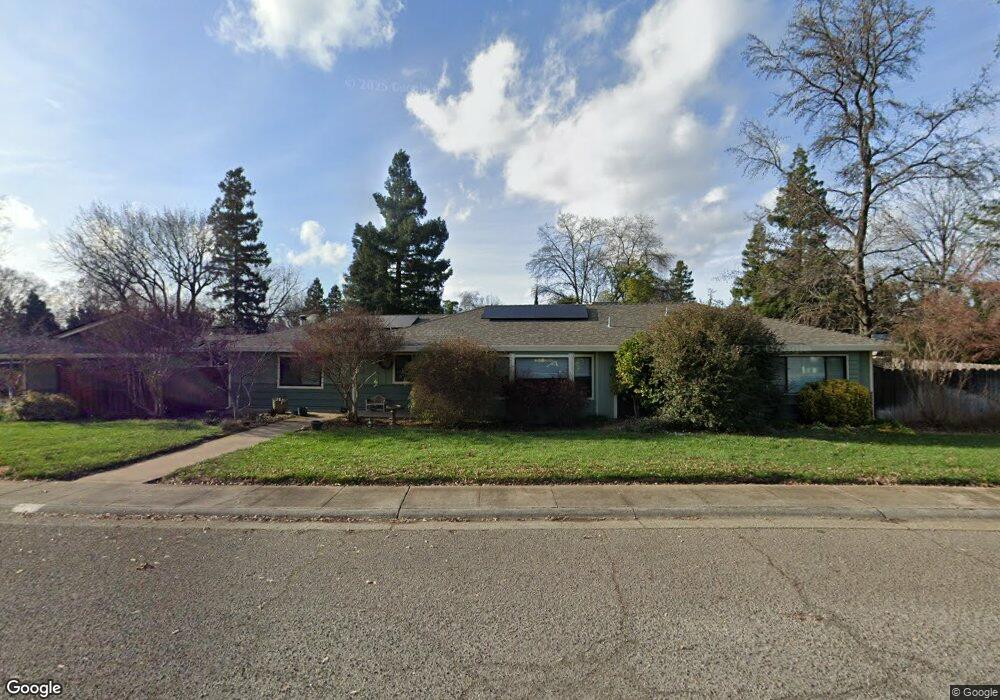
485 Sequoyah Ave Chico, CA 95926
Chico Vecino NeighborhoodEstimated Value: $437,947 - $487,000
3
Beds
2
Baths
2,036
Sq Ft
$229/Sq Ft
Est. Value
About This Home
This home is located at 485 Sequoyah Ave, Chico, CA 95926 and is currently estimated at $465,237, approximately $228 per square foot. 485 Sequoyah Ave is a home located in Butte County with nearby schools including Citrus Avenue Elementary School, Chico Junior High School, and Chico High School.
Ownership History
Date
Name
Owned For
Owner Type
Purchase Details
Closed on
Jul 23, 2020
Sold by
Hitchko Michael J and Hitchko Michael J
Bought by
Hitchko Michael J and Hitchko Sharon M
Current Estimated Value
Home Financials for this Owner
Home Financials are based on the most recent Mortgage that was taken out on this home.
Original Mortgage
$267,500
Outstanding Balance
$213,384
Interest Rate
3.1%
Mortgage Type
New Conventional
Estimated Equity
$251,853
Purchase Details
Closed on
Jan 16, 2020
Sold by
Hitchko Michael J and Hitchko Sharon M
Bought by
Hitchko Michael J and Hitchko Sharon M
Purchase Details
Closed on
Feb 11, 2002
Sold by
Va
Bought by
Hitchko Michael J and Hitchko Sharon M
Home Financials for this Owner
Home Financials are based on the most recent Mortgage that was taken out on this home.
Original Mortgage
$143,250
Interest Rate
6.99%
Create a Home Valuation Report for This Property
The Home Valuation Report is an in-depth analysis detailing your home's value as well as a comparison with similar homes in the area
Home Values in the Area
Average Home Value in this Area
Purchase History
| Date | Buyer | Sale Price | Title Company |
|---|---|---|---|
| Hitchko Michael J | -- | Placer Title Company | |
| Hitchko Michael J | -- | None Available | |
| Hitchko Michael J | -- | Fidelity National Title Co |
Source: Public Records
Mortgage History
| Date | Status | Borrower | Loan Amount |
|---|---|---|---|
| Open | Hitchko Michael J | $267,500 | |
| Closed | Hitchko Michael J | $143,250 |
Source: Public Records
Tax History
| Year | Tax Paid | Tax Assessment Tax Assessment Total Assessment is a certain percentage of the fair market value that is determined by local assessors to be the total taxable value of land and additions on the property. | Land | Improvement |
|---|---|---|---|---|
| 2025 | $2,125 | $202,433 | $63,383 | $139,050 |
| 2024 | $2,125 | $198,465 | $62,141 | $136,324 |
| 2023 | $2,099 | $194,574 | $60,923 | $133,651 |
| 2022 | $2,062 | $190,760 | $59,729 | $131,031 |
| 2021 | $2,022 | $187,020 | $58,558 | $128,462 |
| 2020 | $2,016 | $185,103 | $57,958 | $127,145 |
| 2019 | $1,978 | $181,474 | $56,822 | $124,652 |
| 2018 | $1,940 | $177,916 | $55,708 | $122,208 |
| 2017 | $1,899 | $174,428 | $54,616 | $119,812 |
| 2016 | $1,732 | $171,009 | $53,546 | $117,463 |
| 2015 | $1,731 | $168,441 | $52,742 | $115,699 |
| 2014 | $1,700 | $165,142 | $51,709 | $113,433 |
Source: Public Records
Map
Nearby Homes
- 719 Picaso Ln
- 505 Mission Santa Fe Cir
- 135 W 9th Ave
- 119 Macdonald Ave
- 165 Rio Lindo Ave
- 1617 Arcadian Ave
- 940 Dias Dr
- 2321 Eugene Ave
- 33 Pebblewood Pines Dr
- 1421 Citrus Ave
- 1110 W 8th Ave Unit 1
- 1110 W 8th Ave Unit 4
- 460 E 10th Ave
- 1044 Southampton Dr
- 1362 Magnolia Ave
- 243 W 3rd Ave
- 33 Quista Dr
- 123 Henshaw Ave Unit 107
- 123 Henshaw Ave Unit 616
- 123 Henshaw Ave Unit 205
- 476 Hoopa Cir
- 501 Sequoyah Ave
- 498 Hoopa Cir
- 480 Sequoyah Ave
- 470 Sequoyah Ave
- 490 Sequoyah Ave
- 460 Sequoyah Ave
- 455 Sequoyah Ave
- 511 Sequoyah Ave
- 481 Hoopa Cir
- 491 Hoopa Cir
- 510 Hoopa Cir
- 471 Hoopa Cir
- 2135 Zuni Ave
- 500 Sequoyah Ave
- 501 Hoopa Cir
- 2129 Zuni Ave
- 510 Sequoyah Ave
- 449 Sequoyah Ave
- 511 Hoopa Cir
Your Personal Tour Guide
Ask me questions while you tour the home.