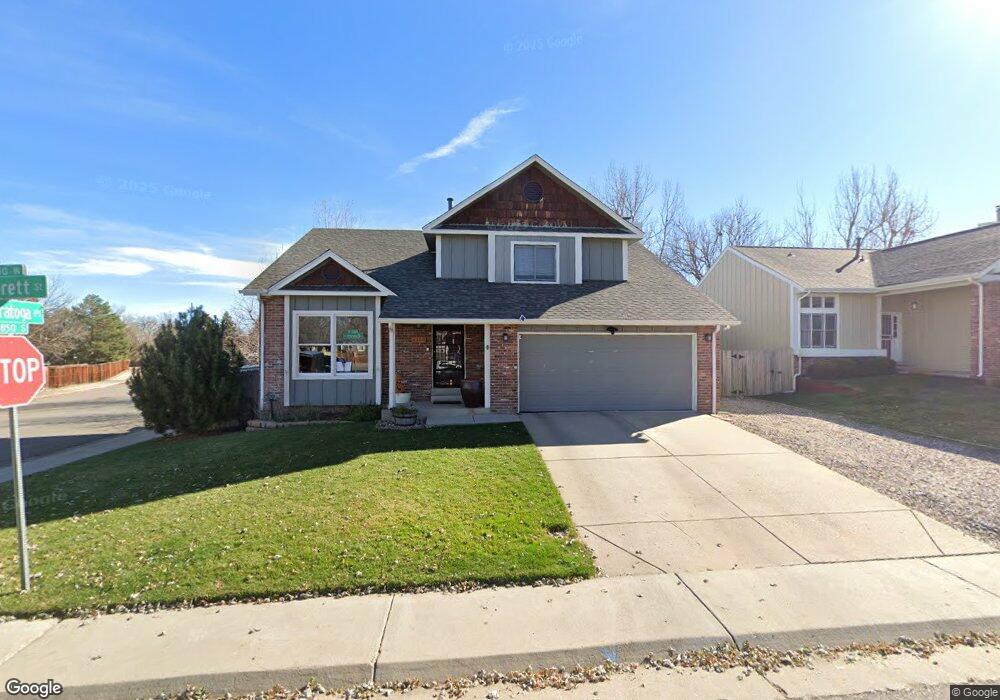
4850 S Everett St Littleton, CO 80123
Marston NeighborhoodEstimated Value: $578,000 - $656,000
3
Beds
3
Baths
2,398
Sq Ft
$255/Sq Ft
Est. Value
About This Home
This home is located at 4850 S Everett St, Littleton, CO 80123 and is currently estimated at $611,301, approximately $254 per square foot. 4850 S Everett St is a home located in Denver County with nearby schools including Grant Ranch School, John F Kennedy High School, and Montessori Peaks Academy.
Ownership History
Date
Name
Owned For
Owner Type
Purchase Details
Closed on
Jun 14, 2019
Sold by
Mackey Kenneth F and Mackey Angela Marie
Bought by
Sean O Donnell and Monday Jessica
Current Estimated Value
Home Financials for this Owner
Home Financials are based on the most recent Mortgage that was taken out on this home.
Original Mortgage
$428,116
Outstanding Balance
$376,419
Interest Rate
4.1%
Mortgage Type
New Conventional
Estimated Equity
$234,882
Purchase Details
Closed on
Mar 20, 2009
Sold by
Ringwald Robert L
Bought by
Mackey Kenneth and Mackey Angela
Home Financials for this Owner
Home Financials are based on the most recent Mortgage that was taken out on this home.
Original Mortgage
$245,471
Interest Rate
5.14%
Mortgage Type
FHA
Purchase Details
Closed on
Dec 11, 2001
Sold by
Rhynard Loyal D and Rhynard Loma M
Bought by
Ringwald Robert L
Home Financials for this Owner
Home Financials are based on the most recent Mortgage that was taken out on this home.
Original Mortgage
$212,800
Interest Rate
6.39%
Create a Home Valuation Report for This Property
The Home Valuation Report is an in-depth analysis detailing your home's value as well as a comparison with similar homes in the area
Home Values in the Area
Average Home Value in this Area
Purchase History
| Date | Buyer | Sale Price | Title Company |
|---|---|---|---|
| Sean O Donnell | $441,357 | Fitco | |
| Mackey Kenneth | $250,000 | Land Title Guarantee Company | |
| Ringwald Robert L | $224,000 | -- |
Source: Public Records
Mortgage History
| Date | Status | Borrower | Loan Amount |
|---|---|---|---|
| Open | Sean O Donnell | $428,116 | |
| Previous Owner | Mackey Kenneth | $245,471 | |
| Previous Owner | Ringwald Robert L | $212,800 |
Source: Public Records
Tax History Compared to Growth
Tax History
| Year | Tax Paid | Tax Assessment Tax Assessment Total Assessment is a certain percentage of the fair market value that is determined by local assessors to be the total taxable value of land and additions on the property. | Land | Improvement |
|---|---|---|---|---|
| 2024 | $2,850 | $35,980 | $1,640 | $34,340 |
| 2023 | $2,788 | $35,980 | $1,640 | $34,340 |
| 2022 | $2,570 | $32,320 | $5,530 | $26,790 |
| 2021 | $2,480 | $33,240 | $5,680 | $27,560 |
| 2020 | $1,873 | $25,240 | $5,680 | $19,560 |
| 2019 | $1,820 | $25,240 | $5,680 | $19,560 |
| 2018 | $1,713 | $22,140 | $5,210 | $16,930 |
| 2017 | $1,708 | $22,140 | $5,210 | $16,930 |
| 2016 | $1,834 | $22,490 | $5,174 | $17,316 |
| 2015 | $1,757 | $22,490 | $5,174 | $17,316 |
| 2014 | $1,388 | $16,710 | $3,980 | $12,730 |
Source: Public Records
Map
Nearby Homes
- 4869 S Dudley St
- 4750 S Dudley St Unit 19
- 4750 S Dudley St Unit 1
- 4896 S Dudley St Unit 9-10
- 4896 S Dudley St Unit 8-2
- 4896 S Dudley St Unit 8
- 4896 S Dudley St Unit 7-7
- 8501 W Union Ave Unit 14
- 4875 S Balsam Way Unit 6-202
- 4899 S Dudley St Unit E1
- 4899 S Dudley St Unit 11A
- 4899 S Dudley St Unit 2
- 4899 S Dudley St Unit 4H
- 4899 S Dudley St Unit 14F
- 4899 S Dudley St Unit 7
- 4899 S Dudley St Unit 15B
- 4644 S Garland Way
- 4934 S Flower Way
- 8481 W Union Ave Unit 201
- 8935 W Swarthmore Dr
- 4860 S Everett St
- 4880 S Everett St
- 4855 S Estes Way
- 4851 S Everett St
- 4865 S Estes Way
- 8852 W Layton Ave
- 4895 S Estes Way
- 4861 S Everett St
- 8862 W Layton Ave
- 4871 S Everett St
- 8842 W Layton Ave
- 8872 W Layton Ave
- 4875 S Everett St
- 8832 W Layton Ave
- 8882 W Layton Ave
- 4877 S Everett St
- 4854 S Estes Way
- 4881 S Everett St
- 8902 W Layton Ave
- 4864 S Estes Way