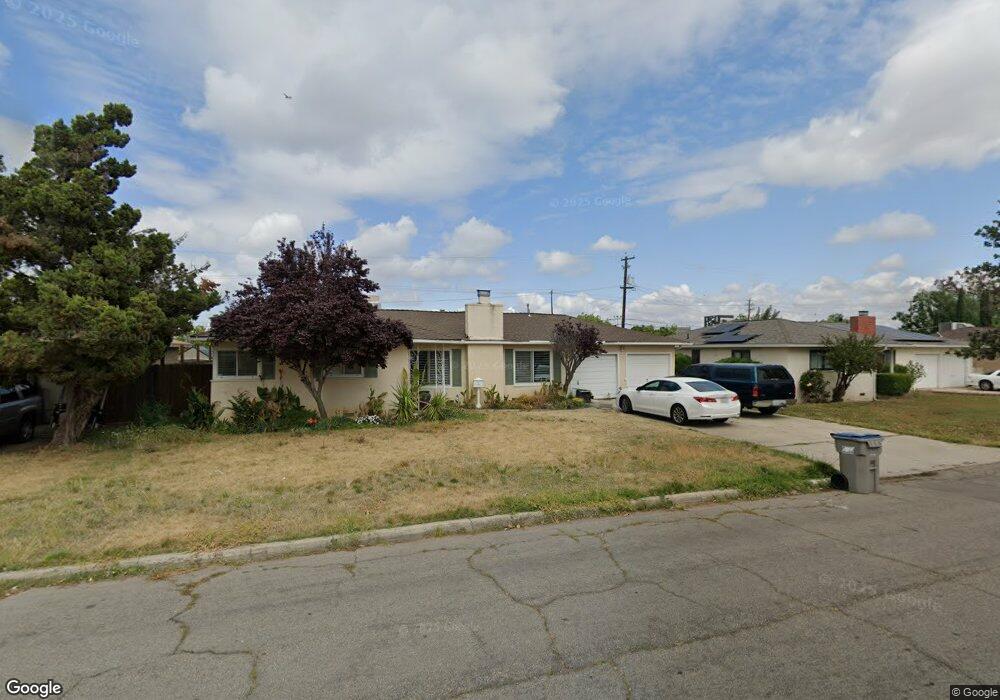
4857 E Simpson Ave Fresno, CA 93703
McLane NeighborhoodEstimated Value: $351,803 - $363,000
2
Beds
2
Baths
1,308
Sq Ft
$272/Sq Ft
Est. Value
About This Home
This home is located at 4857 E Simpson Ave, Fresno, CA 93703 and is currently estimated at $355,601, approximately $271 per square foot. 4857 E Simpson Ave is a home located in Fresno County with nearby schools including Ericson Elementary School, Scandinavian Middle School, and Mclane High School.
Ownership History
Date
Name
Owned For
Owner Type
Purchase Details
Closed on
Jan 29, 2010
Sold by
Lee Michael A
Bought by
Lee Tabitha Z
Current Estimated Value
Purchase Details
Closed on
Oct 20, 2009
Sold by
The Bank Of New York Mellon
Bought by
Lee Tabitha Z
Home Financials for this Owner
Home Financials are based on the most recent Mortgage that was taken out on this home.
Original Mortgage
$80,350
Interest Rate
5.03%
Mortgage Type
New Conventional
Purchase Details
Closed on
Jun 2, 2009
Sold by
Pacheco Bernardo
Bought by
The Bank Of New York Mellon
Purchase Details
Closed on
Jul 27, 2006
Sold by
Balbuena Audifas
Bought by
Pacheco Bernardo
Home Financials for this Owner
Home Financials are based on the most recent Mortgage that was taken out on this home.
Original Mortgage
$208,000
Interest Rate
8.54%
Mortgage Type
Purchase Money Mortgage
Purchase Details
Closed on
Jul 18, 2006
Sold by
Royal Capital Fundins Inc
Bought by
Pacheco Bernado
Home Financials for this Owner
Home Financials are based on the most recent Mortgage that was taken out on this home.
Original Mortgage
$208,000
Interest Rate
8.54%
Mortgage Type
Purchase Money Mortgage
Purchase Details
Closed on
Mar 7, 2006
Sold by
Serrano Jose R and Serrano Michelle R
Bought by
Royal Capital Funding Inc
Purchase Details
Closed on
Apr 11, 2003
Sold by
Jackson Darian T and Jackson Andrea C
Bought by
Serrano Jose R and Serrano Michelle R
Home Financials for this Owner
Home Financials are based on the most recent Mortgage that was taken out on this home.
Original Mortgage
$135,000
Interest Rate
5.75%
Mortgage Type
Purchase Money Mortgage
Purchase Details
Closed on
Dec 24, 2001
Sold by
Jackson Darian and Jackson Andrea
Bought by
Jackson Darian T and Jackson Andrea C
Home Financials for this Owner
Home Financials are based on the most recent Mortgage that was taken out on this home.
Original Mortgage
$40,000
Interest Rate
6.29%
Mortgage Type
Stand Alone Second
Purchase Details
Closed on
Apr 18, 2000
Sold by
Green Ralph K and Green Phyllis B
Bought by
Jackson Darian and Jackson Andrea
Home Financials for this Owner
Home Financials are based on the most recent Mortgage that was taken out on this home.
Original Mortgage
$72,507
Interest Rate
8.18%
Mortgage Type
FHA
Create a Home Valuation Report for This Property
The Home Valuation Report is an in-depth analysis detailing your home's value as well as a comparison with similar homes in the area
Home Values in the Area
Average Home Value in this Area
Purchase History
| Date | Buyer | Sale Price | Title Company |
|---|---|---|---|
| Lee Tabitha Z | -- | North American Title Company | |
| Lee Tabitha Z | $89,500 | Landsafe Title Company | |
| The Bank Of New York Mellon | $80,541 | Landsafe Title | |
| Pacheco Bernardo | -- | Chicago Title Company | |
| Pacheco Bernado | $260,000 | Chicago Title Company | |
| Royal Capital Funding Inc | -- | Chicago Title Company | |
| Serrano Jose R | $135,000 | Fidelity National Title Co | |
| Jackson Darian T | -- | Transcontinental Title Co | |
| Jackson Darian | $73,000 | Fidelity National Title Co |
Source: Public Records
Mortgage History
| Date | Status | Borrower | Loan Amount |
|---|---|---|---|
| Previous Owner | Lee Tabitha Z | $80,350 | |
| Previous Owner | Pacheco Bernardo | $208,000 | |
| Previous Owner | Pacheco Bernado | $52,000 | |
| Previous Owner | Serrano Jose R | $135,000 | |
| Previous Owner | Jackson Darian T | $40,000 | |
| Previous Owner | Jackson Darian | $72,507 | |
| Closed | Serrano Jose R | $5,400 |
Source: Public Records
Tax History
| Year | Tax Paid | Tax Assessment Tax Assessment Total Assessment is a certain percentage of the fair market value that is determined by local assessors to be the total taxable value of land and additions on the property. | Land | Improvement |
|---|---|---|---|---|
| 2025 | $1,387 | $115,516 | $38,719 | $76,797 |
| 2023 | $1,305 | $111,032 | $37,216 | $73,816 |
| 2022 | $1,286 | $108,856 | $36,487 | $72,369 |
| 2021 | $1,249 | $106,722 | $35,772 | $70,950 |
| 2020 | $1,243 | $105,629 | $35,406 | $70,223 |
| 2019 | $1,193 | $103,559 | $34,712 | $68,847 |
| 2018 | $1,166 | $101,530 | $34,032 | $67,498 |
| 2017 | $1,145 | $99,540 | $33,365 | $66,175 |
| 2016 | $1,105 | $97,589 | $32,711 | $64,878 |
| 2015 | $1,087 | $96,124 | $32,220 | $63,904 |
| 2014 | $1,066 | $94,242 | $31,589 | $62,653 |
Source: Public Records
Map
Nearby Homes
- 4883 E Michigan Ave
- 4715 E Harvard Ave
- 4633 E Cornell Ave
- 2130 N Garden Ave
- 4636 E Cortland Ave
- 2024 N Laureen Ave
- 2146 N Maple Ave
- 1745 N Winery Ave Unit 102
- 1745 N Winery Ave Unit 144
- 1745 N Winery Ave Unit 140
- 2004 N Maple Ave
- 4560 E Cambridge Ave
- 5098 E Ashlan Ave Unit 117
- 5118 E Ashlan Ave Unit 102
- 6770 E Oslin Ave
- 6781 E Oslin Ave
- 6786 E Oslin Ave
- 6789 E Oslin Ave
- 5138 E Ashlan Ave Unit 101
- 5138 E Ashlan Ave Unit 106
- 4863 E Simpson Ave
- 4851 E Simpson Ave
- 4845 E Simpson Ave
- 4869 E Simpson Ave
- 4854 E Simpson Ave
- 4860 E Simpson Ave
- 4848 E Simpson Ave
- 4866 E Simpson Ave
- 4839 E Simpson Ave
- 4875 E Simpson Ave
- 4842 E Simpson Ave
- 4872 E Simpson Ave
- 4853 E Cornell Ave
- 4859 E Cornell Ave
- 4847 E Cornell Ave
- 4865 E Cornell Ave
- 4836 E Simpson Ave
- 4833 E Simpson Ave
- 4841 E Cornell Ave
- 4878 E Simpson Ave
Your Personal Tour Guide
Ask me questions while you tour the home.