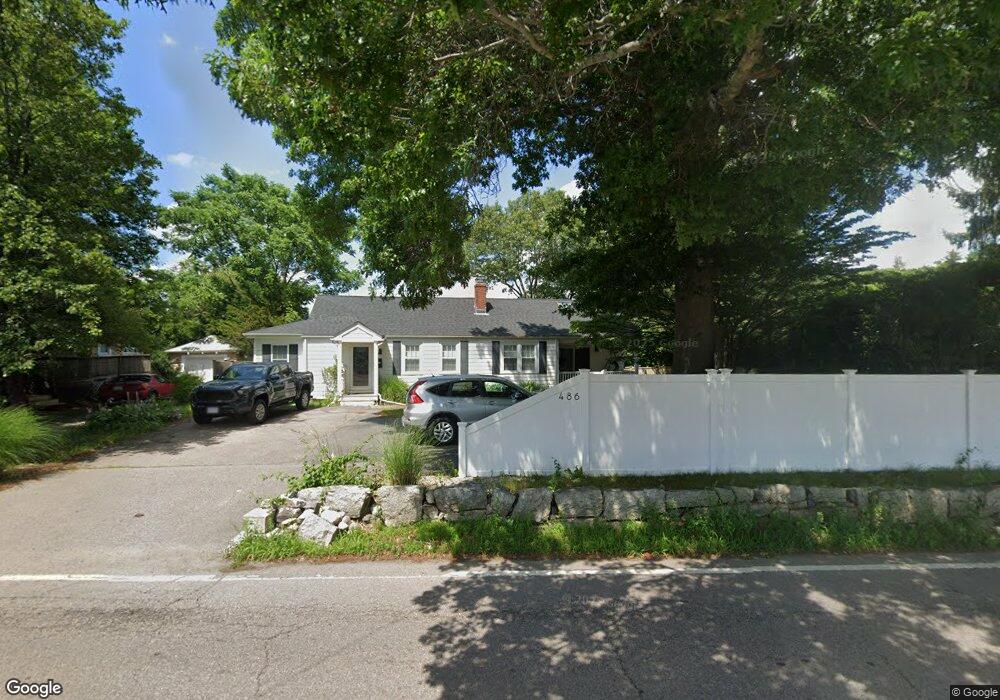
486 Bolivar St Canton, MA 02021
Estimated Value: $694,791 - $726,000
2
Beds
2
Baths
1,518
Sq Ft
$467/Sq Ft
Est. Value
About This Home
This home is located at 486 Bolivar St, Canton, MA 02021 and is currently estimated at $708,198, approximately $466 per square foot. 486 Bolivar St is a home located in Norfolk County with nearby schools including Canton High School and St. John the Evangelist School.
Ownership History
Date
Name
Owned For
Owner Type
Purchase Details
Closed on
Jun 28, 2019
Sold by
Moles Melissa
Bought by
Moles Matthew F and Moles Irma M
Current Estimated Value
Home Financials for this Owner
Home Financials are based on the most recent Mortgage that was taken out on this home.
Original Mortgage
$250,000
Outstanding Balance
$219,826
Interest Rate
4%
Mortgage Type
New Conventional
Estimated Equity
$488,372
Purchase Details
Closed on
May 29, 2009
Sold by
Sloan Paul V and Sloan Linda
Bought by
Moles Melissa
Home Financials for this Owner
Home Financials are based on the most recent Mortgage that was taken out on this home.
Original Mortgage
$292,500
Interest Rate
4.87%
Mortgage Type
Purchase Money Mortgage
Purchase Details
Closed on
May 30, 1997
Sold by
Atsinger Victor A and Atsinger Shannon M
Bought by
Sloan Paul V and Sloan Linda
Purchase Details
Closed on
Aug 2, 1995
Sold by
Healey Exr Ellen M
Bought by
Atsinger Victor A and Atsinger Shannon M
Create a Home Valuation Report for This Property
The Home Valuation Report is an in-depth analysis detailing your home's value as well as a comparison with similar homes in the area
Home Values in the Area
Average Home Value in this Area
Purchase History
| Date | Buyer | Sale Price | Title Company |
|---|---|---|---|
| Moles Matthew F | $450,000 | -- | |
| Moles Matthew F | $450,000 | -- | |
| Moles Melissa | $325,000 | -- | |
| Moles Melissa | $325,000 | -- | |
| Sloan Paul V | $132,000 | -- | |
| Atsinger Victor A | $116,500 | -- |
Source: Public Records
Mortgage History
| Date | Status | Borrower | Loan Amount |
|---|---|---|---|
| Open | Moles Matthew F | $250,000 | |
| Closed | Moles Matthew F | $250,000 | |
| Previous Owner | Atsinger Victor A | $287,000 | |
| Previous Owner | Moles Melissa | $292,500 |
Source: Public Records
Tax History Compared to Growth
Tax History
| Year | Tax Paid | Tax Assessment Tax Assessment Total Assessment is a certain percentage of the fair market value that is determined by local assessors to be the total taxable value of land and additions on the property. | Land | Improvement |
|---|---|---|---|---|
| 2025 | $5,564 | $562,600 | $294,600 | $268,000 |
| 2024 | $5,479 | $549,500 | $283,300 | $266,200 |
| 2023 | $5,383 | $509,300 | $283,300 | $226,000 |
| 2022 | $5,224 | $460,300 | $269,800 | $190,500 |
| 2021 | $5,089 | $417,100 | $245,200 | $171,900 |
| 2020 | $4,861 | $397,500 | $233,600 | $163,900 |
| 2019 | $4,586 | $369,800 | $212,300 | $157,500 |
| 2018 | $4,417 | $355,600 | $204,100 | $151,500 |
| 2017 | $4,461 | $348,800 | $200,100 | $148,700 |
| 2016 | $4,382 | $342,600 | $195,200 | $147,400 |
| 2015 | $4,305 | $335,800 | $189,600 | $146,200 |
Source: Public Records
Map
Nearby Homes
- 25 Pine St Unit B
- 23 Pine St Unit K
- 859 Pleasant St
- 141 Shaw Farm Rd Unit 141
- 56 Laurelwood Dr
- 149 Bolivar St Unit B4
- 59 Rosewood Dr
- 230 Greenbrook Dr
- 54 Laurelwood Dr
- 189 Bailey St
- 40 Elderwood Dr
- 4 Forge Pond Unit E
- 27 Ward Well Rd
- 19 Walnut Knolls
- 18 Cherrywood Dr Unit 18
- 109 Greenbrook Dr Unit 109
- 651 Washington St
- 717 Washington St Unit G
- 20 Audubon Way Unit 109
- 20 Audubon Way Unit 105
- 484 Bolivar St
- 7 Springdale Terrace
- 490 Bolivar St
- 5 Springdale Terrace
- 480 Bolivar St
- 474 Bolivar St
- 485 Bolivar St
- 487 Bolivar St
- 492 Bolivar St
- 6 Springdale Terrace
- 477 Bolivar St
- 3 Springdale Terrace
- 4 Springdale Terrace
- 548 Bolivar St
- 467 Bolivar St
- 4 Lantern Ln
- 450 Bolivar St
- 25 Pine St Unit M
- 25 Pine St Unit L
- 25 Pine St Unit K