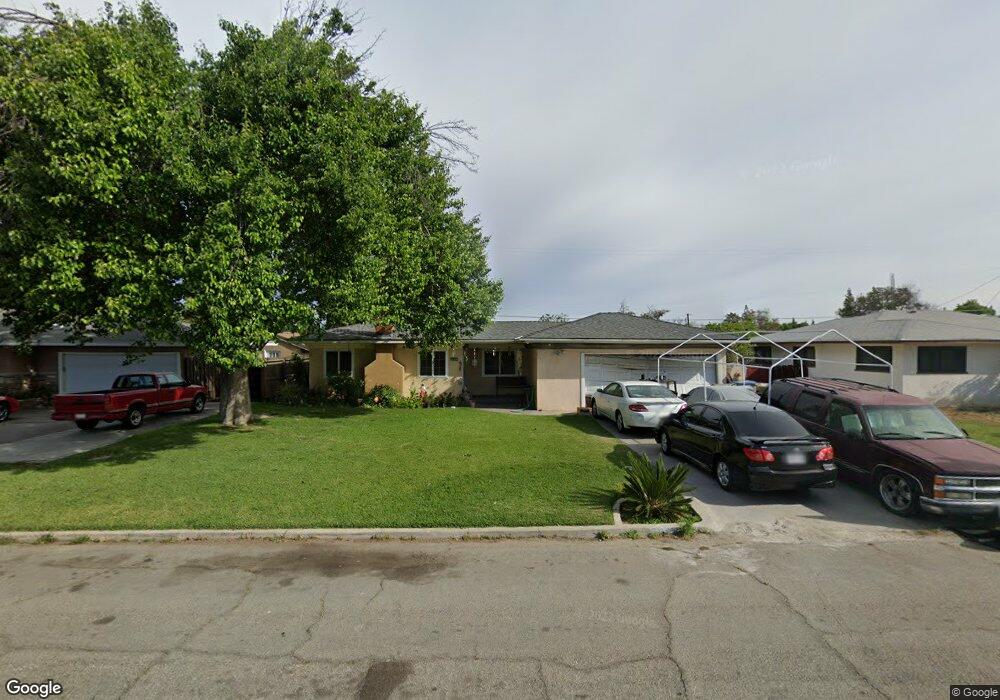
4863 E Princeton Ave Fresno, CA 93703
McLane NeighborhoodEstimated Value: $298,000 - $324,000
3
Beds
2
Baths
1,160
Sq Ft
$269/Sq Ft
Est. Value
About This Home
This home is located at 4863 E Princeton Ave, Fresno, CA 93703 and is currently estimated at $311,984, approximately $268 per square foot. 4863 E Princeton Ave is a home located in Fresno County with nearby schools including Ericson Elementary School, Scandinavian Middle School, and Mclane High School.
Ownership History
Date
Name
Owned For
Owner Type
Purchase Details
Closed on
Jun 26, 2023
Sold by
Saldana Agustin and Saldana Veronica
Bought by
Saldana Veronica and Saldana Brandon N
Current Estimated Value
Purchase Details
Closed on
Apr 7, 2000
Sold by
Berwanger Lorraine L
Bought by
Saldana Agustin and Saldana Veronica
Home Financials for this Owner
Home Financials are based on the most recent Mortgage that was taken out on this home.
Original Mortgage
$69,053
Interest Rate
8.25%
Mortgage Type
FHA
Purchase Details
Closed on
Jan 26, 2000
Sold by
Walter Duniec and Walter Sheila R
Bought by
Berwanger Lorraine L
Purchase Details
Closed on
Sep 14, 1994
Sold by
Berwanger Lorraine L
Bought by
Duniec Walter and Duniec Sheila R
Home Financials for this Owner
Home Financials are based on the most recent Mortgage that was taken out on this home.
Original Mortgage
$65,000
Interest Rate
8.58%
Mortgage Type
Seller Take Back
Create a Home Valuation Report for This Property
The Home Valuation Report is an in-depth analysis detailing your home's value as well as a comparison with similar homes in the area
Home Values in the Area
Average Home Value in this Area
Purchase History
| Date | Buyer | Sale Price | Title Company |
|---|---|---|---|
| Saldana Veronica | -- | None Listed On Document | |
| Saldana Agustin | -- | First American Title Co | |
| Berwanger Lorraine L | $61,076 | Chicago Title Co | |
| Duniec Walter | $70,000 | Stewart Title Co |
Source: Public Records
Mortgage History
| Date | Status | Borrower | Loan Amount |
|---|---|---|---|
| Previous Owner | Saldana Agustin | $69,053 | |
| Previous Owner | Duniec Walter | $65,000 | |
| Closed | Saldana Agustin | $3,682 |
Source: Public Records
Tax History Compared to Growth
Tax History
| Year | Tax Paid | Tax Assessment Tax Assessment Total Assessment is a certain percentage of the fair market value that is determined by local assessors to be the total taxable value of land and additions on the property. | Land | Improvement |
|---|---|---|---|---|
| 2025 | $3,720 | $106,819 | $35,350 | $71,469 |
| 2023 | $3,720 | $102,648 | $33,967 | $68,681 |
| 2022 | $2,750 | $100,636 | $33,301 | $67,335 |
| 2021 | $2,716 | $98,664 | $32,649 | $66,015 |
| 2020 | $2,665 | $97,654 | $32,315 | $65,339 |
| 2019 | $2,619 | $95,740 | $31,682 | $64,058 |
| 2018 | $2,589 | $93,863 | $31,061 | $62,802 |
| 2017 | $2,549 | $92,023 | $30,452 | $61,571 |
| 2016 | $1,017 | $90,219 | $29,855 | $60,364 |
| 2015 | $1,000 | $88,865 | $29,407 | $59,458 |
| 2014 | $981 | $87,125 | $28,831 | $58,294 |
Source: Public Records
Map
Nearby Homes
- 4787 E Cornell Ave
- 4791 E Simpson Ave
- 2441 N Chestnut Ave
- 4747 E Clinton Ave
- 4704 E Simpson Ave
- 4674 E Princeton Ave
- 4625 E Princeton Ave
- 1745 N Winery Ave Unit 102
- 4875 E Mckinley Ave Unit 129
- 2243 E Cambridge Ave
- 4641 E Weldon Ave
- 4843 E Oslin Ave
- 4597 E Cambridge Ave
- 4819 E Home Ave
- 4617 E Garland Ave
- 4942 E Oslin Ave
- 4808 E Pine Ave
- 4454 E Simpson Ave
- 1431 N Willow Ave
- 6523 E Sooner Dr
- 4869 E Princeton Ave
- 4857 E Princeton Ave
- 4864 E Michigan Ave
- 4858 E Michigan Ave
- 4870 E Michigan Ave
- 4851 E Princeton Ave
- 4875 E Princeton Ave
- 4852 E Michigan Ave
- 4864 E Princeton Ave
- 4876 E Michigan Ave
- 4874 E Princeton Ave
- 4845 E Princeton Ave
- 4881 E Princeton Ave
- 4854 E Princeton Ave
- 4882 E Princeton Ave
- 4846 E Michigan Ave
- 4882 E Michigan Ave
- 4865 E Michigan Ave
- 4859 E Michigan Ave
- 4871 E Michigan Ave