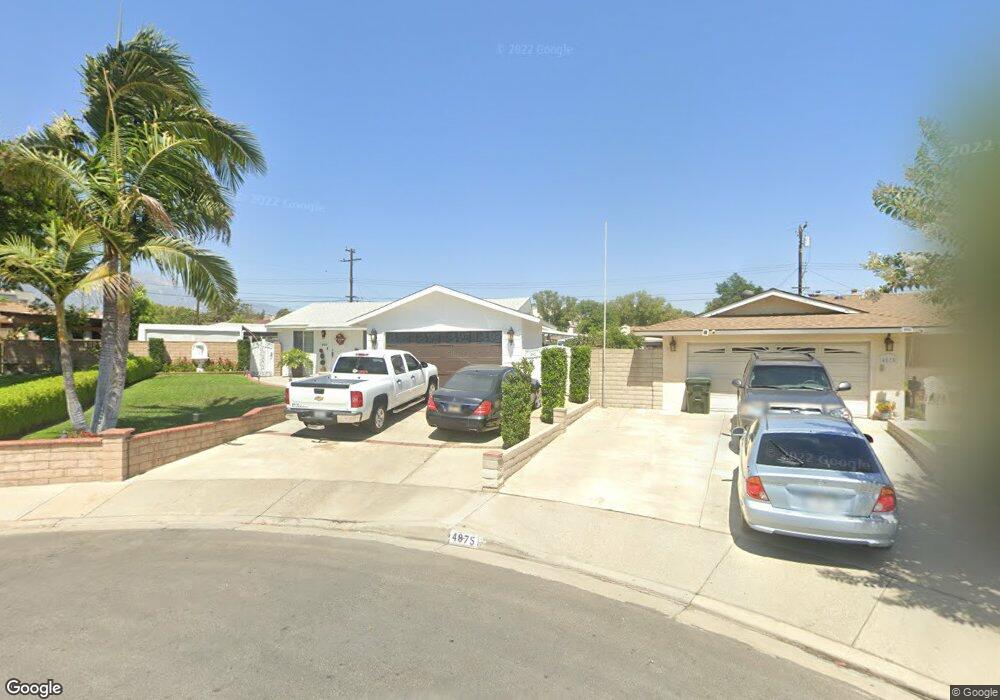
4864 Highland St Montclair, CA 91763
Estimated Value: $624,000 - $697,000
About This Home
This home is located at 4864 Highland St, Montclair, CA 91763 and is currently estimated at $664,862, approximately $457 per square foot. 4864 Highland St is a home located in San Bernardino County with nearby schools including Moreno Elementary, Serrano Middle School, and Montclair High School.
Ownership History
We collect this data history from publicly available records. To have your information removed, we recommend requesting removal directly through your county’s website.
Purchase Details
Home Financials for this Owner
Home Financials are based on the most recent Mortgage that was taken out on this home.Home Values in the Area
Average Home Value in this Area
Purchase History
We collect this data history from publicly available records. To have your information removed, we recommend requesting removal directly through your county’s website.
| Date | Buyer | Sale Price | Title Company |
|---|---|---|---|
| $170,000 | First American Title |
Mortgage History
We collect this data history from publicly available records. To have your information removed, we recommend requesting removal directly through your county’s website.
| Date | Status | Borrower | Loan Amount |
|---|---|---|---|
| Open | $155,295 |
Tax History
We collect this data history from publicly available records. To have your information removed, we recommend requesting removal directly through your county’s website.
| Year | Tax Paid | Tax Assessment Tax Assessment Total Assessment is a certain percentage of the fair market value that is determined by local assessors to be the total taxable value of land and additions on the property. | Land | Improvement |
|---|---|---|---|---|
| 2025 | $2,751 | $256,165 | $75,343 | $180,822 |
| 2024 | $2,687 | $251,142 | $73,866 | $177,276 |
| 2023 | $2,610 | $246,218 | $72,418 | $173,800 |
| 2022 | $2,574 | $241,390 | $70,998 | $170,392 |
| 2021 | $2,557 | $236,657 | $69,606 | $167,051 |
| 2020 | $3,256 | $234,230 | $68,892 | $165,338 |
| 2019 | $3,539 | $229,637 | $67,541 | $162,096 |
| 2018 | $3,459 | $225,135 | $66,217 | $158,918 |
| 2017 | $3,383 | $220,721 | $64,919 | $155,802 |
| 2016 | $3,263 | $216,393 | $63,646 | $152,747 |
| 2015 | $3,224 | $213,143 | $62,690 | $150,453 |
| 2014 | $3,090 | $208,968 | $61,462 | $147,506 |
Map
- 8951 Monte Vista Ave
- 4963 Laurel Unit C
- 4956 Willow Unit E
- 4956 Willow Unit C
- 8847 Jacaranda Unit C
- 8836 Banyan
- 9133 Camulos Ave
- 4622 San Jose St Unit H
- 224 S Mills Ave
- 9362 Shadowood Dr Unit G
- 517 Wayland Ct
- 2584 Blanchard Place
- 436 Oakdale Dr
- 5151 E Arrow Hwy
- 416 Oakdale Dr
- 4424 San Jose St Unit 3
- 352 Golden Bear Ln
- 385 Sycamore Ave
- 9554 Tudor Ave
- 518 Converse Ave
- 4863 Olive St
- 4873 Olive St
- 4853 Olive St
- 4854 Highland St
- 4844 Highland St
- 4862 Olive St
- 4843 Olive St
- 4872 Olive St
- 4893 Olive St
- 9043 Surrey Ave
- 9046 Monte Vista Ave
- 4852 Olive St
- 4882 Olive St
- 4834 Highland St
- 9056 Monte Vista Ave
- 4842 Olive St
- 4875 Highland St
- 4892 Olive St
- 9066 Monte Vista Ave
- 4865 Highland St
Ask me questions while you tour the home.