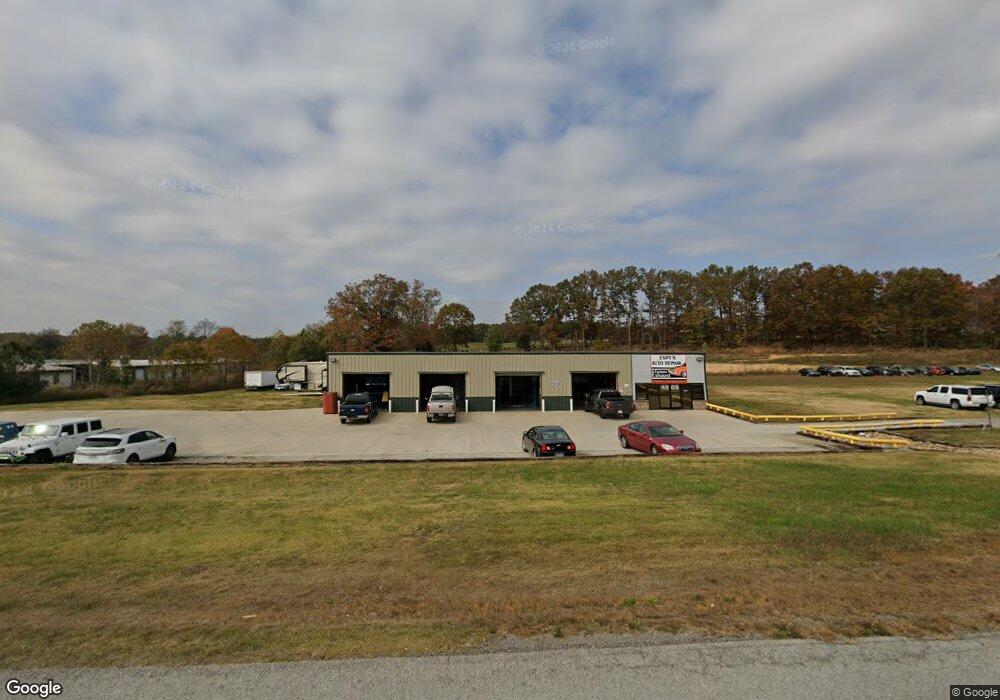
4866 New Tullahoma Hwy Manchester, TN 37355
Estimated Value: $543,542
--
Bed
1
Bath
4,000
Sq Ft
$136/Sq Ft
Est. Value
About This Home
This home is located at 4866 New Tullahoma Hwy, Manchester, TN 37355 and is currently estimated at $543,542, approximately $135 per square foot. 4866 New Tullahoma Hwy is a home located in Coffee County with nearby schools including Westwood Middle School.
Ownership History
Date
Name
Owned For
Owner Type
Purchase Details
Closed on
Sep 22, 2016
Sold by
Arneson Jeff G
Bought by
Espy Joey and Espy Christy Johnston
Current Estimated Value
Home Financials for this Owner
Home Financials are based on the most recent Mortgage that was taken out on this home.
Original Mortgage
$184,000
Outstanding Balance
$146,972
Interest Rate
3.43%
Mortgage Type
Mortgage Modification
Estimated Equity
$396,570
Purchase Details
Closed on
Dec 29, 2008
Sold by
Arneson Jeff G
Bought by
Arneson Jeff G
Purchase Details
Closed on
Oct 19, 2007
Sold by
Partin Richard L
Bought by
Arneson Jeff G
Purchase Details
Closed on
Jan 13, 2005
Bought by
Partin Richard L and Partin Peggy
Purchase Details
Closed on
Jun 22, 1999
Sold by
Parin Richard and Parin Peggy
Bought by
Partin Richard and Partin Peggy S T
Purchase Details
Closed on
Apr 2, 1998
Sold by
Sutton James L
Bought by
Parin Richard and Parin Peggy
Purchase Details
Closed on
May 29, 1997
Sold by
Sutton James L
Bought by
Sutton Martha R
Purchase Details
Closed on
Dec 31, 1985
Bought by
Sutton James L
Create a Home Valuation Report for This Property
The Home Valuation Report is an in-depth analysis detailing your home's value as well as a comparison with similar homes in the area
Home Values in the Area
Average Home Value in this Area
Purchase History
| Date | Buyer | Sale Price | Title Company |
|---|---|---|---|
| Espy Joey | $230,000 | -- | |
| Arneson Jeff G | -- | -- | |
| Arneson Jeff G | $93,000 | -- | |
| Partin Richard L | -- | -- | |
| Partin Richard | -- | -- | |
| Parin Richard | $82,000 | -- | |
| Sutton Martha R | -- | -- | |
| Sutton James L | $50,000 | -- |
Source: Public Records
Mortgage History
| Date | Status | Borrower | Loan Amount |
|---|---|---|---|
| Open | Espy Joey | $184,000 |
Source: Public Records
Tax History Compared to Growth
Tax History
| Year | Tax Paid | Tax Assessment Tax Assessment Total Assessment is a certain percentage of the fair market value that is determined by local assessors to be the total taxable value of land and additions on the property. | Land | Improvement |
|---|---|---|---|---|
| 2024 | $2,834 | $93,080 | $18,240 | $74,840 |
| 2023 | $2,834 | $93,080 | $0 | $0 |
| 2022 | $3,379 | $93,080 | $18,240 | $74,840 |
| 2021 | $4,206 | $91,840 | $19,080 | $72,760 |
| 2020 | $4,206 | $91,840 | $19,080 | $72,760 |
| 2019 | $4,206 | $91,840 | $19,080 | $72,760 |
| 2018 | $4,206 | $91,840 | $19,080 | $72,760 |
| 2017 | $4,505 | $85,880 | $12,200 | $73,680 |
| 2016 | $4,459 | $85,880 | $12,200 | $73,680 |
| 2015 | $4,459 | $85,000 | $11,640 | $73,360 |
| 2014 | $4,459 | $85,000 | $0 | $0 |
Source: Public Records
Map
Nearby Homes
- 4775 New Tullahoma Hwy
- 363 Waterford Dr
- 482 Old Seminary Rd
- 53 Jesse Ct
- 954 Belmont Rd
- 205 Nature Ridge Rd
- 4547 Old Manchester Hwy
- 78 Willow Pointe Dr
- 4342 New Manchester Hwy
- 2674 New Tullahoma Hwy
- 2397 Mt View Rd
- 287 Randall Ln
- 319 Randall Ln
- 345 Randall Ln
- 375 Randall Ln
- 255 Randall Ln
- 905 Royal Trail
- 65 Anthony Mill Rd
- 112 Reynard St
- 99 Anthony Mill Rd
- 4795 New Tullahoma Hwy Unit 4795
- 45 Bryan Blvd
- 4757 New Tullahoma Hwy Unit 4757
- 46 Bryan Ln
- 4916 Old Tullahoma Hwy Unit 4916
- 4650 New Tullahoma Hwy Unit 4664
- 4660 New Tullahoma Hwy
- 88 Bryan Ln
- 4847 Old Tullahoma Hwy Unit 4847
- 5218 Old Tullahoma Hwy
- 188 Bryan Blvd
- 4620 New Tullahoma Hwy
- 0 New Manchester Hwy
- 233 Bryan Blvd
- 4819 Old Tullahoma Hwy
- 202 Bryan Blvd
- 1 Waterford Dr
- 3 Waterford Dr
- 10 Waterford Dr
- 7 Waterford Dr Lot #7