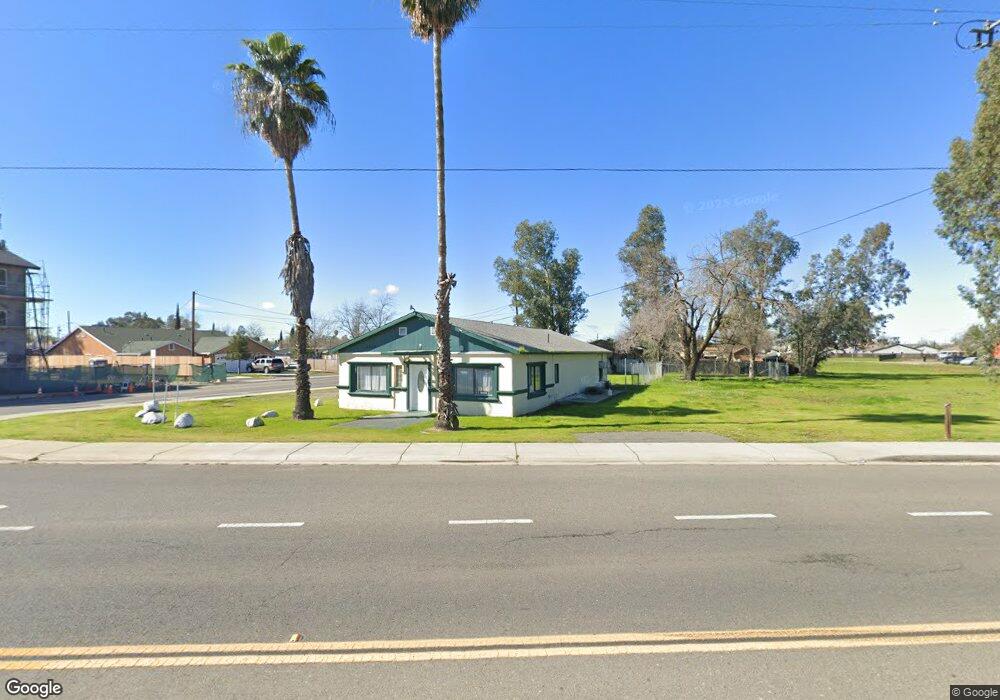
4866 Powerline Rd Olivehurst, CA 95961
Estimated Value: $546,209
3
Beds
2
Baths
1,800
Sq Ft
$303/Sq Ft
Est. Value
About This Home
This home is located at 4866 Powerline Rd, Olivehurst, CA 95961 and is currently estimated at $546,209, approximately $303 per square foot. 4866 Powerline Rd is a home located in Yuba County with nearby schools including Ella Elementary School, Yuba Gardens Intermediate School, and Lindhurst High School.
Ownership History
Date
Name
Owned For
Owner Type
Purchase Details
Closed on
Sep 18, 2020
Sold by
Calvary Crstn Chr Ctr Of Sacramento Ca I
Bought by
Hope Holdings Lp
Current Estimated Value
Purchase Details
Closed on
Sep 21, 2007
Sold by
Morales Fidel and Morales Maria L
Bought by
Calvary Christian Church Center Of Sacra
Purchase Details
Closed on
Oct 11, 2005
Sold by
Meigs Wesley
Bought by
Morales Fidel and Morales Maria L
Purchase Details
Closed on
Apr 1, 2004
Sold by
Meigs Ophelia and Northcraft Ophelia
Bought by
Meigs Wesly
Home Financials for this Owner
Home Financials are based on the most recent Mortgage that was taken out on this home.
Original Mortgage
$40,000
Interest Rate
5.56%
Mortgage Type
Seller Take Back
Create a Home Valuation Report for This Property
The Home Valuation Report is an in-depth analysis detailing your home's value as well as a comparison with similar homes in the area
Home Values in the Area
Average Home Value in this Area
Purchase History
| Date | Buyer | Sale Price | Title Company |
|---|---|---|---|
| Hope Holdings Lp | -- | None Available | |
| Calvary Christian Church Center Of Sacra | $335,000 | North American Title Co | |
| Morales Fidel | $250,000 | North State Title Company | |
| Meigs Wesly | $50,000 | North State Title Company |
Source: Public Records
Mortgage History
| Date | Status | Borrower | Loan Amount |
|---|---|---|---|
| Previous Owner | Meigs Wesly | $40,000 |
Source: Public Records
Tax History Compared to Growth
Tax History
| Year | Tax Paid | Tax Assessment Tax Assessment Total Assessment is a certain percentage of the fair market value that is determined by local assessors to be the total taxable value of land and additions on the property. | Land | Improvement |
|---|---|---|---|---|
| 2025 | $2,400 | $212,154 | $54,121 | $158,033 |
| 2023 | $2,400 | $203,918 | $52,020 | $151,898 |
| 2022 | $2,331 | $199,920 | $51,000 | $148,920 |
| 2021 | $2,305 | $196,000 | $50,000 | $146,000 |
| 2020 | $626 | $402,338 | $144,118 | $258,220 |
| 2019 | $613 | $394,450 | $141,293 | $253,157 |
| 2018 | $596 | $386,717 | $138,523 | $248,194 |
| 2017 | $578 | $379,135 | $135,807 | $243,328 |
| 2016 | $573 | $371,702 | $133,145 | $238,557 |
| 2015 | $4,236 | $366,120 | $131,146 | $234,974 |
| 2014 | -- | $358,950 | $128,578 | $230,372 |
Source: Public Records
Map
Nearby Homes
- 1943 Chapman Ave
- 1859 Turpen St
- 2045 Chicory St
- 1958 Cannon Ct
- 1969 Cannon Ct
- 4736 Fleming Way
- 4827 Olivehurst Ave
- 1956-3 7th Ave
- 1956-4 7th Ave
- 1835 7th Ave
- 4950 Tulsa Ave
- 1631 7th Ave
- 5192 Chestnut Rd
- 5057 Canal St
- 802 Berryessa Way
- 1720 Hicks Ave
- 4835 Arboga Rd
- 4771 Arboga Rd
- 4688 Pacific Ave
- 4470 College Way
- 1949 7th Ave
- 1943 7th Ave
- 4834 Powerline Rd
- 1946 7th Ave
- 1937 7th Ave
- 1931 7th Ave
- 1943 Chapman Ave
- 1925 7th Ave
- 4912 Powerline Rd
- 4816 Powerline Rd
- 1926 7th Ave
- 1927 Chapman Ave
- 1952 Chapman Ave
- 1944 Chapman Ave
- 4900 Powerline Rd
- 1940 Chapman Ave
- 1908 7th Ave
- 1934 Chapman Ave
- 4798 Powerline Rd
- 1926 Chapman Ave