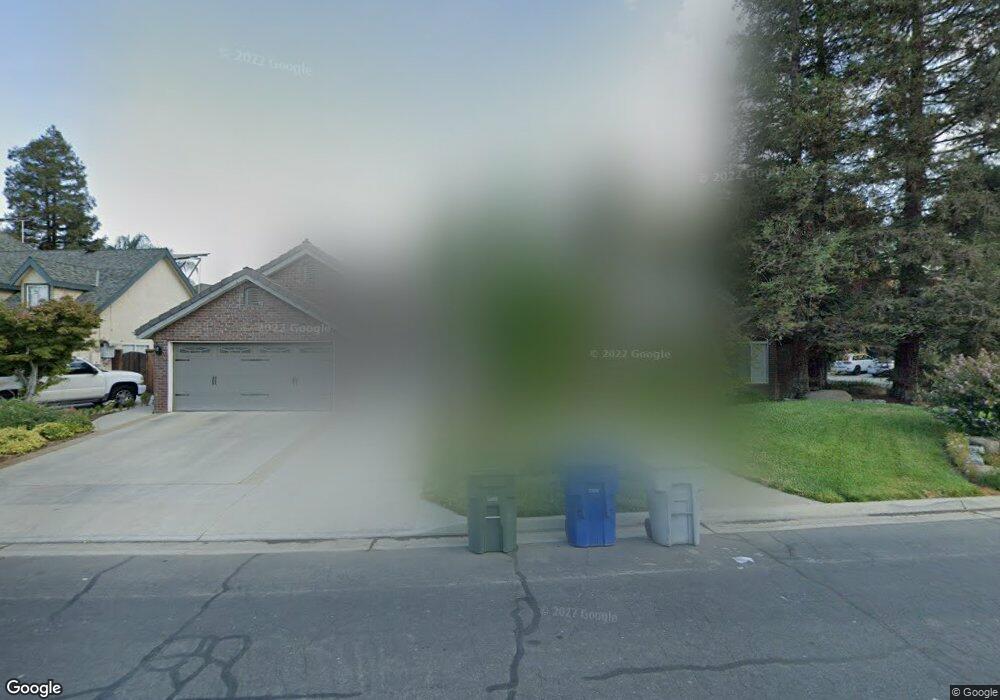
487 W Cromwell Ave Clovis, CA 93611
Estimated Value: $658,000 - $709,228
4
Beds
3
Baths
2,745
Sq Ft
$248/Sq Ft
Est. Value
About This Home
This home is located at 487 W Cromwell Ave, Clovis, CA 93611 and is currently estimated at $682,076, approximately $248 per square foot. 487 W Cromwell Ave is a home located in Fresno County with nearby schools including Garfield Elementary School, Alta Sierra Intermediate School, and Buchanan High School.
Ownership History
Date
Name
Owned For
Owner Type
Purchase Details
Closed on
Jul 3, 2018
Sold by
Roberts James L
Bought by
Roberts James L and James L Roberts Living Trust
Current Estimated Value
Purchase Details
Closed on
Jun 16, 2003
Sold by
Roberts James L and Roberts Linda Joyce
Bought by
Roberts James L and Roberts Linda J
Home Financials for this Owner
Home Financials are based on the most recent Mortgage that was taken out on this home.
Original Mortgage
$280,000
Outstanding Balance
$120,426
Interest Rate
5.53%
Mortgage Type
Purchase Money Mortgage
Estimated Equity
$561,650
Purchase Details
Closed on
Jun 14, 1994
Sold by
Smittcamp Earl S and Smittcamp Muriel
Bought by
Roberts James L and Roberts Linda Joyce
Home Financials for this Owner
Home Financials are based on the most recent Mortgage that was taken out on this home.
Original Mortgage
$203,150
Interest Rate
8.38%
Create a Home Valuation Report for This Property
The Home Valuation Report is an in-depth analysis detailing your home's value as well as a comparison with similar homes in the area
Home Values in the Area
Average Home Value in this Area
Purchase History
| Date | Buyer | Sale Price | Title Company |
|---|---|---|---|
| Roberts James L | -- | None Available | |
| Roberts James L | -- | Chicago Title Company | |
| Roberts James L | $67,500 | Central Title Company |
Source: Public Records
Mortgage History
| Date | Status | Borrower | Loan Amount |
|---|---|---|---|
| Open | Roberts James L | $280,000 | |
| Closed | Roberts James L | $203,150 |
Source: Public Records
Tax History
| Year | Tax Paid | Tax Assessment Tax Assessment Total Assessment is a certain percentage of the fair market value that is determined by local assessors to be the total taxable value of land and additions on the property. | Land | Improvement |
|---|---|---|---|---|
| 2025 | $5,268 | $439,467 | $113,363 | $326,104 |
| 2023 | $5,056 | $422,404 | $108,962 | $313,442 |
| 2022 | $4,989 | $414,123 | $106,826 | $307,297 |
| 2021 | $4,831 | $406,004 | $104,732 | $301,272 |
| 2020 | $4,812 | $401,842 | $103,659 | $298,183 |
| 2019 | $4,720 | $393,964 | $101,627 | $292,337 |
| 2018 | $4,618 | $386,240 | $99,635 | $286,605 |
| 2017 | $4,539 | $378,668 | $97,682 | $280,986 |
| 2016 | $4,388 | $371,244 | $95,767 | $275,477 |
| 2015 | $4,308 | $365,669 | $94,329 | $271,340 |
| 2014 | $4,229 | $358,507 | $92,482 | $266,025 |
Source: Public Records
Map
Nearby Homes
- 450 W Alluvial Ave
- 2991 E Cromwell Ave
- 684 W Chennault Ave
- 484 W Balsam Ln
- 602 W Mahogany Ln
- 2845 E Goshen Ave
- 2740 E El Paso Ave
- 635 W Quincy Ave
- 166 Bedford Ave
- 2776 E Muncie Ave
- 2658 E Alluvial Ave Unit 120
- 2658 E Alluvial Ave Unit 220
- 2878 E Omaha Ave
- 351 N Peach Ave
- 2825 E Quincy Ave
- 2545 E Goshen Ave
- 2707 E Omaha Ave
- 2669 E Sean Ave
- 7835 N Matus Ave
- 1634 N Cindy Ave
- 497 W Cromwell Ave
- 958 N Citadel Ave
- 516 W Decatur Ave
- 484 W Cromwell Ave
- 947 N Citadel Ave
- 517 W Cromwell Ave
- 494 W Cromwell Ave
- 937 N Citadel Ave
- 506 W Cromwell Ave
- 526 W Decatur Ave
- 527 W Cromwell Ave
- 451 W Bedford Ave
- 505 W Decatur Ave
- 471 W Bedford Ave
- 514 W Cromwell Ave
- 927 N Citadel Ave
- 493 W Bedford Ave
- 536 W Decatur Ave
- 501 W Bedford Ave
- 525 W Decatur Ave
Your Personal Tour Guide
Ask me questions while you tour the home.