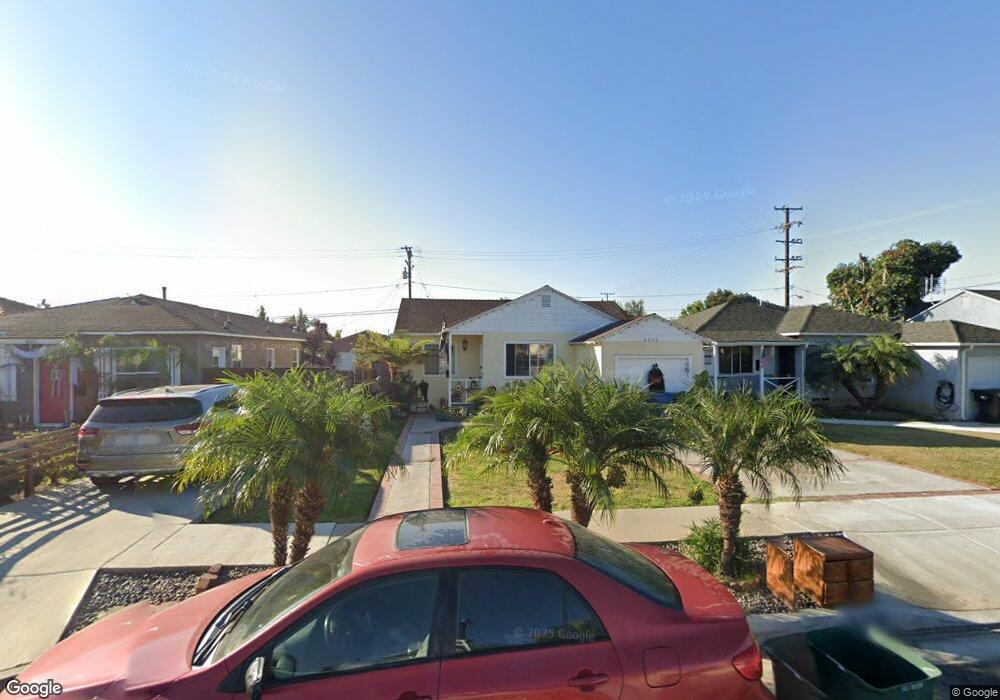
4870 W 132nd St Hawthorne, CA 90250
Del Aire NeighborhoodEstimated Value: $783,000 - $1,026,000
3
Beds
2
Baths
1,425
Sq Ft
$638/Sq Ft
Est. Value
About This Home
This home is located at 4870 W 132nd St, Hawthorne, CA 90250 and is currently estimated at $909,131, approximately $637 per square foot. 4870 W 132nd St is a home located in Los Angeles County with nearby schools including Hollyglen Elementary School, Aviation Elementary School, and Richard Henry Dana Middle School.
Ownership History
Date
Name
Owned For
Owner Type
Purchase Details
Closed on
Sep 16, 1999
Sold by
Sawitzki Gunter Paul and Sawitzki Irmgard
Bought by
Sazo Sergio Rolando
Current Estimated Value
Home Financials for this Owner
Home Financials are based on the most recent Mortgage that was taken out on this home.
Original Mortgage
$130,500
Outstanding Balance
$39,134
Interest Rate
7.97%
Estimated Equity
$869,997
Purchase Details
Closed on
Aug 3, 1995
Sold by
Prendergast Richard T and Sawitzki Gunter Paul
Bought by
Sawitzki Gunter Paul
Purchase Details
Closed on
Mar 23, 1994
Sold by
Sawitzki Irmgard and Holland Irmgard
Bought by
Prendergast Richard T
Home Financials for this Owner
Home Financials are based on the most recent Mortgage that was taken out on this home.
Original Mortgage
$142,611
Interest Rate
7.59%
Mortgage Type
Seller Take Back
Create a Home Valuation Report for This Property
The Home Valuation Report is an in-depth analysis detailing your home's value as well as a comparison with similar homes in the area
Home Values in the Area
Average Home Value in this Area
Purchase History
| Date | Buyer | Sale Price | Title Company |
|---|---|---|---|
| Sazo Sergio Rolando | $145,000 | Fidelity Title | |
| Sawitzki Gunter Paul | $152,274 | -- | |
| Prendergast Richard T | $143,000 | North American Title Company |
Source: Public Records
Mortgage History
| Date | Status | Borrower | Loan Amount |
|---|---|---|---|
| Open | Sazo Sergio Rolando | $130,500 | |
| Previous Owner | Prendergast Richard T | $142,611 |
Source: Public Records
Tax History Compared to Growth
Tax History
| Year | Tax Paid | Tax Assessment Tax Assessment Total Assessment is a certain percentage of the fair market value that is determined by local assessors to be the total taxable value of land and additions on the property. | Land | Improvement |
|---|---|---|---|---|
| 2025 | $4,064 | $295,440 | $178,278 | $117,162 |
| 2024 | $4,064 | $289,648 | $174,783 | $114,865 |
| 2023 | $3,923 | $283,969 | $171,356 | $112,613 |
| 2022 | $3,902 | $278,402 | $167,997 | $110,405 |
| 2021 | $3,769 | $272,944 | $164,703 | $108,241 |
| 2019 | $3,736 | $264,851 | $159,819 | $105,032 |
| 2018 | $3,616 | $259,659 | $156,686 | $102,973 |
| 2016 | $3,474 | $249,577 | $150,602 | $98,975 |
| 2015 | $3,460 | $245,829 | $148,340 | $97,489 |
| 2014 | $3,428 | $241,015 | $145,435 | $95,580 |
Source: Public Records
Map
Nearby Homes
- 4878 W 133rd St
- 4813 W 130th St
- 5039 W 134th St
- 5030 W 130th St
- 4750 W 133rd St
- 5116 W 130th St
- 4688 W 131st St
- 5126 W El Segundo Blvd
- 4622 W 131st St
- 12621 Costa Dr
- 4653 W 137th Place
- 5004 W 138th St
- 4487 W 131st St
- 4474 W 133rd St
- 4526 W 136th St
- 4509 W 136th St Unit A & B
- 5254 W 127th St
- 4748 W 140th St
- 4761 W 141st St
- 5344 W 137th St
- 4866 W 132nd St
- 4874 W 132nd St
- 4878 W 132nd St
- 4862 W 132nd St
- 4858 W 132nd St
- 4873 W 133rd St
- 4869 W 133rd St
- 4877 W 133rd St
- 4865 W 133rd St
- 4881 W 133rd St
- 4902 W 132nd St
- 4854 W 132nd St
- 4861 W 133rd St
- 4871 W 132nd St
- 4875 W 132nd St
- 4869 W 132nd St
- 4879 W 132nd St
- 4865 W 132nd St
- 4850 W 132nd St
- 4906 W 132nd St