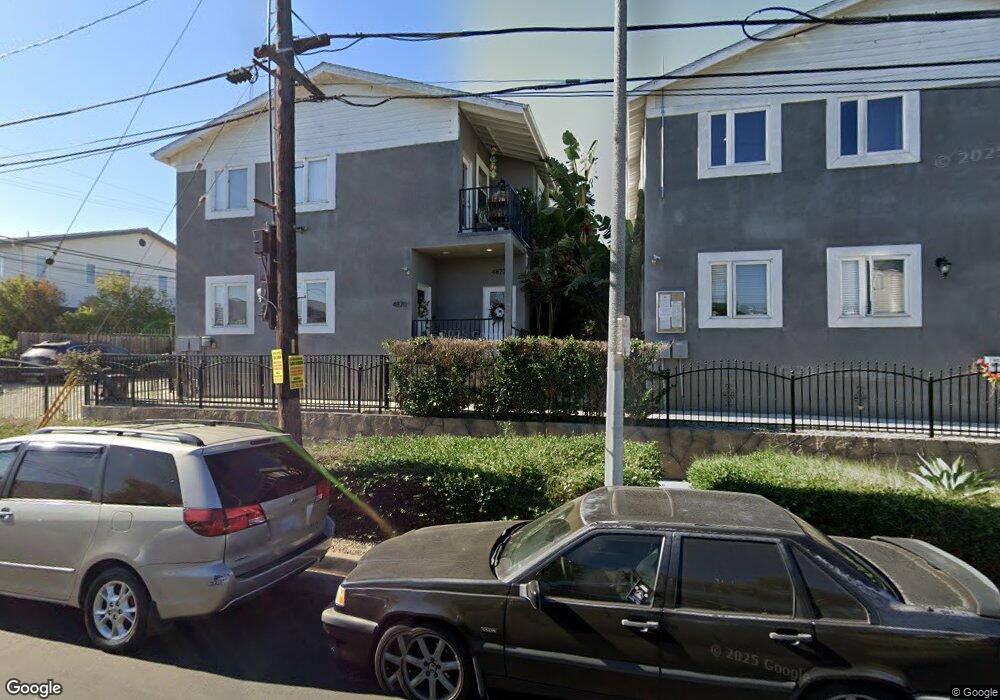
4872 S St Elmo Ave Los Angeles, CA 90019
Mid-City NeighborhoodEstimated Value: $1,117,000 - $2,522,000
3
Beds
2
Baths
1,250
Sq Ft
$1,433/Sq Ft
Est. Value
About This Home
This home is located at 4872 S St Elmo Ave, Los Angeles, CA 90019 and is currently estimated at $1,791,333, approximately $1,433 per square foot. 4872 S St Elmo Ave is a home located in Los Angeles County with nearby schools including Alta Loma Elementary, Johnnie L. Cochran Jr. Middle School, and Los Angeles Senior High School.
Ownership History
Date
Name
Owned For
Owner Type
Purchase Details
Closed on
May 11, 2018
Sold by
Janus Development Llc
Bought by
Krom Joshua
Current Estimated Value
Home Financials for this Owner
Home Financials are based on the most recent Mortgage that was taken out on this home.
Original Mortgage
$1,000,000
Outstanding Balance
$866,081
Interest Rate
4.75%
Mortgage Type
Adjustable Rate Mortgage/ARM
Estimated Equity
$925,252
Purchase Details
Closed on
Apr 23, 2018
Sold by
Simon Genn Meredith
Bought by
Krom Joshua
Home Financials for this Owner
Home Financials are based on the most recent Mortgage that was taken out on this home.
Original Mortgage
$1,000,000
Outstanding Balance
$866,081
Interest Rate
4.75%
Mortgage Type
Adjustable Rate Mortgage/ARM
Estimated Equity
$925,252
Purchase Details
Closed on
Aug 5, 2016
Sold by
Krom Averill
Bought by
Janus Development Llc
Purchase Details
Closed on
Jul 26, 2016
Sold by
County Of Los Angeles
Bought by
Krom Averill
Create a Home Valuation Report for This Property
The Home Valuation Report is an in-depth analysis detailing your home's value as well as a comparison with similar homes in the area
Home Values in the Area
Average Home Value in this Area
Purchase History
| Date | Buyer | Sale Price | Title Company |
|---|---|---|---|
| Krom Joshua | -- | Old Republic Title Company | |
| Krom Joshua | -- | Old Republic Title Company | |
| Janus Development Llc | -- | Fidelity Sherman Oaks | |
| Krom Averill | $580,000 | Fidelity Sherman Oaks |
Source: Public Records
Mortgage History
| Date | Status | Borrower | Loan Amount |
|---|---|---|---|
| Open | Krom Joshua | $1,000,000 |
Source: Public Records
Tax History Compared to Growth
Tax History
| Year | Tax Paid | Tax Assessment Tax Assessment Total Assessment is a certain percentage of the fair market value that is determined by local assessors to be the total taxable value of land and additions on the property. | Land | Improvement |
|---|---|---|---|---|
| 2025 | $17,607 | $1,446,858 | $673,136 | $773,722 |
| 2024 | $17,607 | $1,418,489 | $659,938 | $758,551 |
| 2023 | $17,273 | $1,390,677 | $646,999 | $743,678 |
| 2022 | $16,479 | $1,363,410 | $634,313 | $729,097 |
| 2021 | $16,256 | $1,336,677 | $621,876 | $714,801 |
| 2020 | $16,419 | $1,322,972 | $615,500 | $707,472 |
| 2019 | $15,773 | $1,297,032 | $603,432 | $693,600 |
| 2018 | $7,299 | $591,600 | $591,600 | $0 |
| 2016 | $2,875 | $224,052 | $156,841 | $67,211 |
| 2015 | $2,835 | $220,688 | $154,486 | $66,202 |
| 2014 | $1,651 | $40,354 | $23,177 | $17,177 |
Source: Public Records
Map
Nearby Homes
- 1733 S Longwood Ave
- 1801 S Longwood Ave
- 4842 W 17th St
- 4835 Pickford St
- 1638 S Longwood Ave
- 5036 Pickford St
- 1623 S Sycamore Ave
- 1680 S Rimpau Blvd
- 4817 Saint Charles Place
- 4725 St Elmo Dr
- 1502 S Redondo Blvd
- 1656 S Rimpau Blvd
- 1801 S Sycamore Ave
- 4710 St Elmo Dr
- 1858 S Orange Dr
- 4701 Saturn St
- 1373 S Orange Dr
- 1626 S Rimpau Blvd
- 1820 Alsace Ave
- 4901 4905 W 20th St
- 1700 S Highland Ave
- 4872 Saint Elmo Dr
- 4870 Saint Elmo Dr
- 1704 S Highland Ave
- 1708 S Highland Ave
- 1670 S Highland Ave
- 4900 Saint Elmo Dr
- 1716 S Highland Ave
- 1737 S Longwood Ave Unit 1/2
- 1737 S Longwood Ave
- 1743 S Longwood Ave
- 1662 S Highland Ave
- 1707 S Highland Ave
- 1718 S Highland Ave
- 1739 S Longwood Ave Unit 1/2
- 1739 S Longwood Ave
- 1711 S Highland Ave
- 1749 S Longwood Ave
- 4905 Saint Elmo Dr
- 4865 Saint Elmo Dr Unit 1