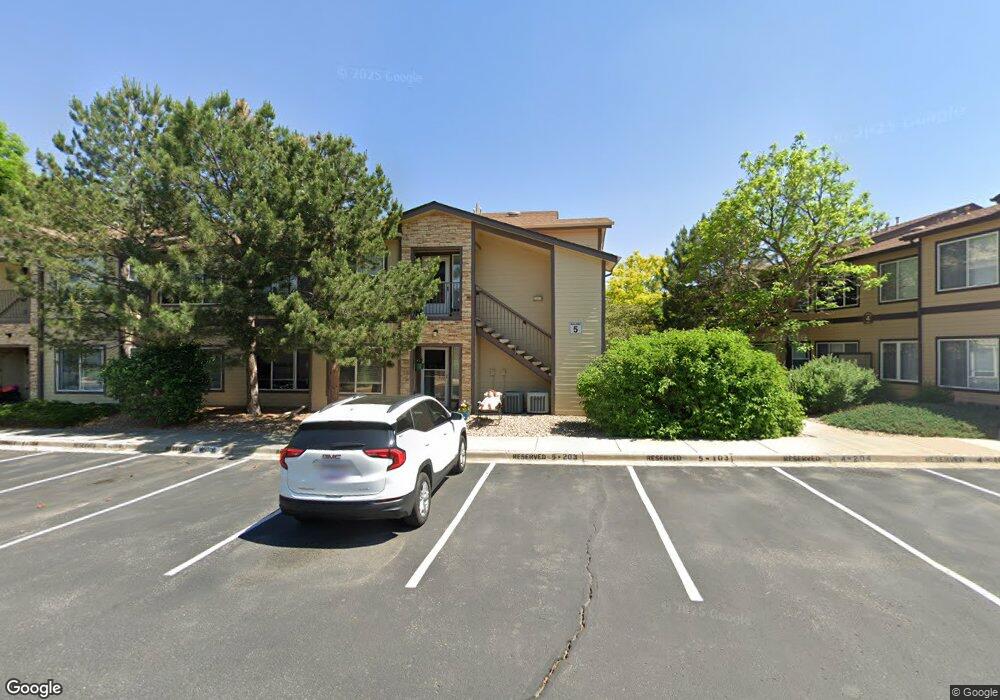
4875 S Balsam Way Littleton, CO 80123
Marston NeighborhoodEstimated Value: $320,000 - $354,000
2
Beds
2
Baths
1,050
Sq Ft
$322/Sq Ft
Est. Value
About This Home
This home is located at 4875 S Balsam Way, Littleton, CO 80123 and is currently estimated at $338,346, approximately $322 per square foot. 4875 S Balsam Way is a home located in Denver County with nearby schools including Grant Ranch School, John F Kennedy High School, and Addenbrooke Classical Grammar School.
Ownership History
Date
Name
Owned For
Owner Type
Purchase Details
Closed on
Nov 16, 2020
Sold by
Bybee Joshua
Bought by
Rauch Kassidy R and Graham Nicholas A
Current Estimated Value
Home Financials for this Owner
Home Financials are based on the most recent Mortgage that was taken out on this home.
Original Mortgage
$271,600
Outstanding Balance
$241,685
Interest Rate
2.8%
Mortgage Type
New Conventional
Estimated Equity
$96,661
Purchase Details
Closed on
Jun 18, 2018
Sold by
Dominiguez Derick D and Dominiguez Wendy J
Bought by
Bybee Joshua
Home Financials for this Owner
Home Financials are based on the most recent Mortgage that was taken out on this home.
Original Mortgage
$251,392
Interest Rate
4.6%
Mortgage Type
VA
Purchase Details
Closed on
Feb 6, 2004
Sold by
Willow Ranch Ii Llc
Bought by
Dominguez Derick D and Dominguez Wendy J
Home Financials for this Owner
Home Financials are based on the most recent Mortgage that was taken out on this home.
Original Mortgage
$85,300
Interest Rate
5.65%
Mortgage Type
Purchase Money Mortgage
Create a Home Valuation Report for This Property
The Home Valuation Report is an in-depth analysis detailing your home's value as well as a comparison with similar homes in the area
Home Values in the Area
Average Home Value in this Area
Purchase History
| Date | Buyer | Sale Price | Title Company |
|---|---|---|---|
| Rauch Kassidy R | $280,000 | Land Title Guarantee Co | |
| Bybee Joshua | $245,500 | Land Title Guarantee Co | |
| Dominguez Derick D | $144,300 | -- |
Source: Public Records
Mortgage History
| Date | Status | Borrower | Loan Amount |
|---|---|---|---|
| Open | Rauch Kassidy R | $271,600 | |
| Previous Owner | Bybee Joshua | $251,392 | |
| Previous Owner | Dominguez Derick D | $85,300 |
Source: Public Records
Tax History Compared to Growth
Tax History
| Year | Tax Paid | Tax Assessment Tax Assessment Total Assessment is a certain percentage of the fair market value that is determined by local assessors to be the total taxable value of land and additions on the property. | Land | Improvement |
|---|---|---|---|---|
| 2024 | $1,469 | $18,550 | $1,780 | $16,770 |
| 2023 | $1,437 | $18,550 | $1,780 | $16,770 |
| 2022 | $1,443 | $18,150 | $1,850 | $16,300 |
| 2021 | $1,443 | $18,670 | $1,900 | $16,770 |
| 2020 | $1,295 | $17,460 | $1,900 | $15,560 |
| 2019 | $1,259 | $17,460 | $1,900 | $15,560 |
| 2018 | $1,129 | $14,590 | $1,920 | $12,670 |
| 2017 | $1,125 | $14,590 | $1,920 | $12,670 |
| 2016 | $966 | $11,840 | $1,950 | $9,890 |
| 2015 | $925 | $11,840 | $1,950 | $9,890 |
| 2014 | $760 | $9,150 | $1,608 | $7,542 |
Source: Public Records
Map
Nearby Homes
- 4896 S Dudley St Unit 9-10
- 4896 S Dudley St Unit 8-2
- 4896 S Dudley St Unit 8
- 4896 S Dudley St Unit 7-7
- 4750 S Dudley St Unit 19
- 4750 S Dudley St Unit 1
- 8501 W Union Ave Unit 14
- 4869 S Dudley St
- 4899 S Dudley St Unit E1
- 4899 S Dudley St Unit 11A
- 4899 S Dudley St Unit 2
- 4899 S Dudley St Unit 4H
- 4899 S Dudley St Unit 14F
- 4899 S Dudley St Unit 7
- 4899 S Dudley St Unit 15B
- 8481 W Union Ave Unit 201
- 7900 W Layton Ave Unit 849
- 4913 S Zephyr St
- 7925 W Layton Ave Unit 507
- 7925 W Layton Ave Unit 529
- 4875 S Balsam Way Unit 13-101
- 4875 S Balsam Way Unit 13-10
- 4747 S Balsam Way Unit 22-203
- 4747 S Balsam Way Unit 102
- 4875 S Balsam Way Unit 12-101
- 4747 S Balsam Way Unit 22-201
- 4747 S Balsam Way Unit 23-202
- 4747 S Balsam Way Unit 20-102
- 4747 S Balsam Way Unit 23-201
- 4875 S Balsam Way Unit 17-101
- 4875 S Balsam Way Unit 3-202
- 4875 S Balsam Way
- 4875 S Balsam Way
- 4875 S Balsam Way
- 4875 S Balsam Way
- 4875 S Balsam Way
- 4875 S Balsam Way
- 4875 S Balsam Way
- 4875 S Balsam Way
- 4875 S Balsam Way Unit 202