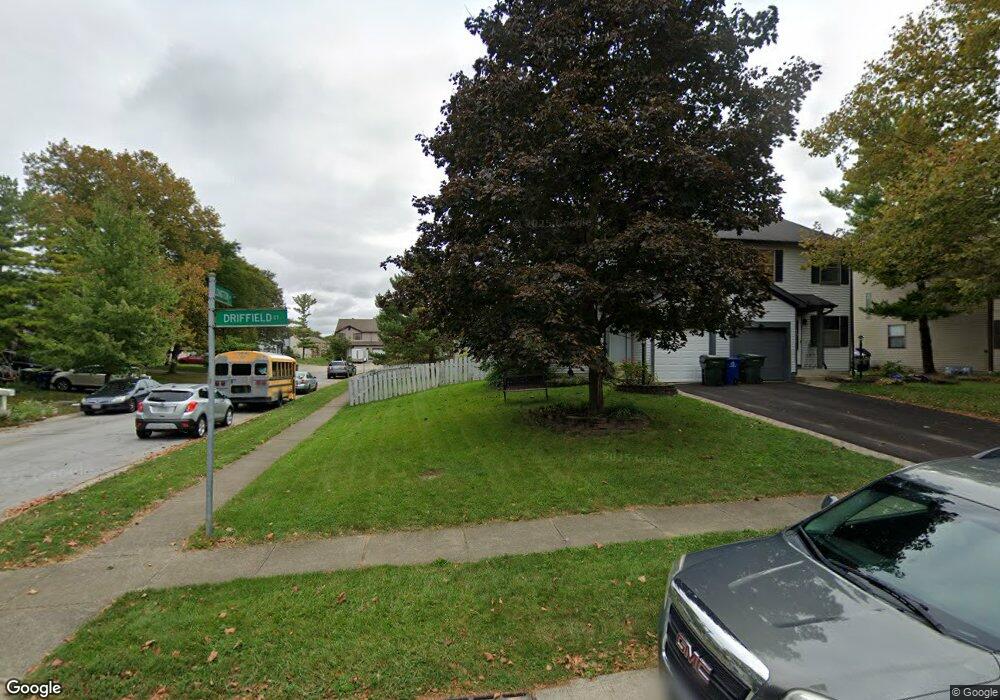
4880 Driffield Ct Columbus, OH 43221
Dexter Falls NeighborhoodEstimated Value: $249,000 - $290,416
4
Beds
3
Baths
1,360
Sq Ft
$196/Sq Ft
Est. Value
About This Home
This home is located at 4880 Driffield Ct, Columbus, OH 43221 and is currently estimated at $266,354, approximately $195 per square foot. 4880 Driffield Ct is a home located in Franklin County with nearby schools including Britton Elementary School, Hilliard Tharp Sixth Grade Elementary School, and Hilliard Weaver Middle School.
Ownership History
Date
Name
Owned For
Owner Type
Purchase Details
Closed on
Mar 31, 2010
Sold by
Bellamy Jeffrey J and Bellamy Lois
Bought by
Gardner Allan D and Gardner Leila R
Current Estimated Value
Home Financials for this Owner
Home Financials are based on the most recent Mortgage that was taken out on this home.
Original Mortgage
$110,953
Outstanding Balance
$74,565
Interest Rate
5.5%
Mortgage Type
FHA
Estimated Equity
$191,789
Purchase Details
Closed on
Jul 31, 1995
Sold by
486 S High Street Co
Bought by
Jeffrey J Bellamy
Home Financials for this Owner
Home Financials are based on the most recent Mortgage that was taken out on this home.
Original Mortgage
$78,528
Interest Rate
7.59%
Mortgage Type
FHA
Purchase Details
Closed on
Nov 25, 1988
Create a Home Valuation Report for This Property
The Home Valuation Report is an in-depth analysis detailing your home's value as well as a comparison with similar homes in the area
Home Values in the Area
Average Home Value in this Area
Purchase History
| Date | Buyer | Sale Price | Title Company |
|---|---|---|---|
| Gardner Allan D | $113,000 | Real Living | |
| Jeffrey J Bellamy | $78,900 | -- | |
| -- | $140,000 | -- |
Source: Public Records
Mortgage History
| Date | Status | Borrower | Loan Amount |
|---|---|---|---|
| Open | Gardner Allan D | $110,953 | |
| Closed | Jeffrey J Bellamy | $78,528 |
Source: Public Records
Tax History
| Year | Tax Paid | Tax Assessment Tax Assessment Total Assessment is a certain percentage of the fair market value that is determined by local assessors to be the total taxable value of land and additions on the property. | Land | Improvement |
|---|---|---|---|---|
| 2025 | $3,752 | $66,430 | $14,350 | $52,080 |
| 2024 | $3,752 | $66,430 | $14,350 | $52,080 |
| 2023 | $3,250 | $66,430 | $14,350 | $52,080 |
| 2022 | $2,673 | $43,750 | $10,500 | $33,250 |
| 2021 | $2,671 | $43,750 | $10,500 | $33,250 |
| 2020 | $2,663 | $43,750 | $10,500 | $33,250 |
| 2019 | $3,119 | $43,750 | $10,500 | $33,250 |
| 2018 | $2,837 | $43,750 | $10,500 | $33,250 |
| 2017 | $3,652 | $51,450 | $10,500 | $40,950 |
| 2016 | $2,739 | $35,740 | $8,470 | $27,270 |
| 2015 | $2,567 | $35,740 | $8,470 | $27,270 |
| 2014 | $2,572 | $35,740 | $8,470 | $27,270 |
| 2013 | $1,240 | $34,020 | $8,050 | $25,970 |
Source: Public Records
Map
Nearby Homes
- 4791 Riverwood Dr
- 3873 Tweedsmuir Dr
- 5049 Dinard Way
- 4674 Coolbrook Dr
- 5017 Calais Dr Unit 5017
- 3921 Antrim Rd
- 3963 Dinon Dr Unit 3963
- 3884 Antrim Rd
- 4253 Davidson Rd
- 3944 Medford Square
- 3913 Shadowstone Way
- 3917 Man o War Ct
- 4260 Darbyshire Ct
- 4316 Shire Cove Rd
- 4325 Cameron Rd
- 5506 Shannon Heights Blvd
- 5500 Saddlebrook Dr
- 4070 Hanover Square Dr Unit 4070
- 0 Hickory Chase Way
- 0 Davidson Rd
- 4874 Driffield Ct
- 4868 Driffield Ct
- 4862 Driffield Ct
- 4883 Herndon Dr
- 4879 Herndon Dr
- 3832 Longton Dr
- 3828 Longton Dr
- 4873 Herndon Dr
- 4856 Driffield Ct
- 3824 Longton Dr
- 3836 Longton Dr
- 3840 Longton Dr
- 4869 Herndon Dr
- 3820 Longton Dr
- 4873 Driffield Ct
- 4869 Driffield Ct
- 3844 Longton Dr
- 3816 Longton Dr
- 4865 Herndon Dr
- 4852 Driffield Ct
Your Personal Tour Guide
Ask me questions while you tour the home.