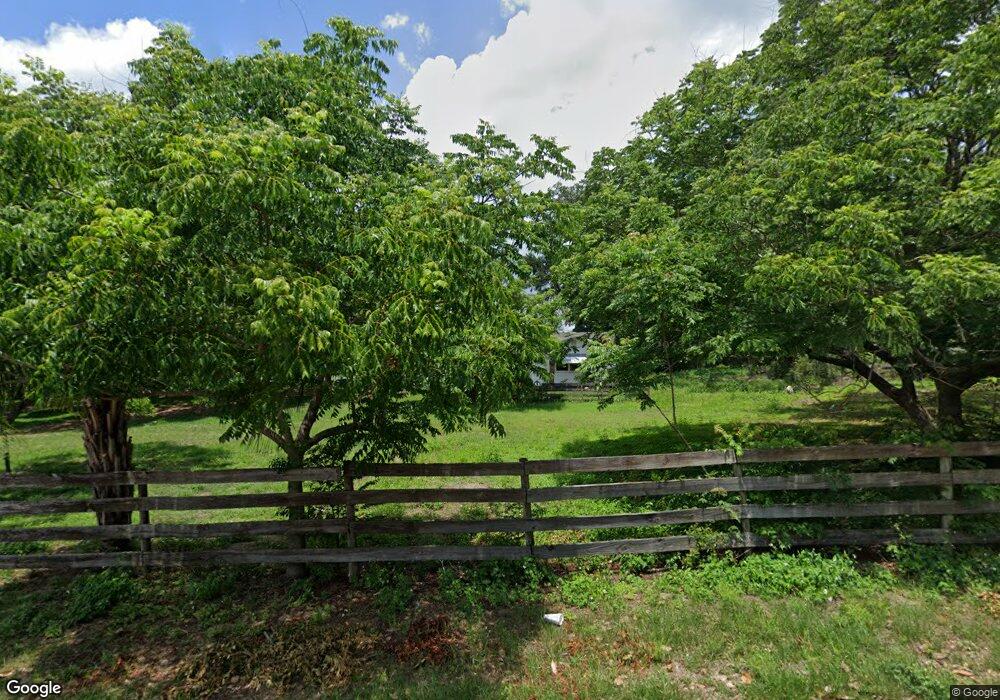
4881 E Van Ness Rd Hernando, FL 34442
Estimated Value: $373,637 - $424,000
3
Beds
2
Baths
2,038
Sq Ft
$199/Sq Ft
Est. Value
About This Home
This home is located at 4881 E Van Ness Rd, Hernando, FL 34442 and is currently estimated at $406,159, approximately $199 per square foot. 4881 E Van Ness Rd is a home located in Citrus County with nearby schools including Hernando Elementary School, Citrus Springs Middle School, and Citrus High School.
Ownership History
Date
Name
Owned For
Owner Type
Purchase Details
Closed on
Feb 25, 2009
Sold by
Vanness Carla and Vanness Van Ness
Bought by
Inch Corporation
Current Estimated Value
Purchase Details
Closed on
Jan 13, 2005
Sold by
Fortmeyer Karen E
Bought by
Portmeyer Karen E
Purchase Details
Closed on
Jan 1, 2005
Bought by
Inch Corporation
Purchase Details
Closed on
Jul 9, 2004
Sold by
Vanness Walter R and Estate Of Keven D Van Ness
Bought by
Fortmeyer Karen
Purchase Details
Closed on
Dec 9, 2003
Sold by
Ramsey Mary C and Vanness Mary C
Bought by
Vanness Walter R and Estate Of Keven D Van Ness
Purchase Details
Closed on
Dec 1, 2003
Bought by
Inch Corporation
Purchase Details
Closed on
May 1, 1999
Bought by
Inch Corporation
Purchase Details
Closed on
Mar 1, 1999
Bought by
Inch Corporation
Create a Home Valuation Report for This Property
The Home Valuation Report is an in-depth analysis detailing your home's value as well as a comparison with similar homes in the area
Home Values in the Area
Average Home Value in this Area
Purchase History
| Date | Buyer | Sale Price | Title Company |
|---|---|---|---|
| Inch Corporation | $225,000 | Stewart Title Company | |
| Vanness Carla | $146,000 | Stewart Title Company | |
| Portmeyer Karen E | -- | -- | |
| Inch Corporation | $100 | -- | |
| Fortmeyer Karen | $132,600 | -- | |
| Vanness Walter R | -- | -- | |
| Inch Corporation | $100 | -- | |
| Inch Corporation | $100 | -- | |
| Inch Corporation | $100 | -- |
Source: Public Records
Tax History
| Year | Tax Paid | Tax Assessment Tax Assessment Total Assessment is a certain percentage of the fair market value that is determined by local assessors to be the total taxable value of land and additions on the property. | Land | Improvement |
|---|---|---|---|---|
| 2025 | $3,580 | $311,410 | $95,990 | $215,420 |
| 2024 | $3,362 | $318,812 | $95,990 | $222,822 |
| 2023 | $3,362 | $163,986 | $0 | $0 |
| 2022 | $2,932 | $260,750 | $95,990 | $164,760 |
| 2021 | $2,251 | $161,560 | $47,140 | $114,420 |
| 2020 | $2,046 | $148,562 | $47,140 | $101,422 |
| 2019 | $2,049 | $159,710 | $68,110 | $91,600 |
| 2018 | $2,029 | $166,990 | $99,630 | $67,360 |
| 2017 | $1,509 | $92,692 | $47,520 | $45,172 |
| 2016 | $1,701 | $101,136 | $60,830 | $40,306 |
| 2015 | $1,658 | $96,281 | $60,830 | $35,451 |
| 2014 | $1,938 | $109,480 | $68,115 | $41,365 |
Source: Public Records
Map
Nearby Homes
- 1438 N Foxrun Terrace
- 4588 E Van Ness Rd
- 4482 E Avocet Ct
- 4480 E Van Ness Rd
- 4457 E Avocet Ct
- 1685 N Arkansas Terrace
- 1573 N Arkansas Terrace
- 4301 E Tennessee Ln
- 4294 E Van Ness Rd
- 4284 E Alabama Ln
- 1271 N Arkansas Terrace
- 1125 N Sabal Palm Way
- 1194 N Timucuan Trail
- 4279 E Texas Ln
- 1635 N Florida Ave
- 3708 E Fair Ct
- 4029 E Walker St
- 800 N Sweet Gum Way
- 1313 N Paul Dr
- 1355 N Reed Terrace
- 4825 E Van Ness Rd
- 4882 E Van Ness Rd
- 4816 E Van Ness Rd
- 1555 N Foxrun Terrace
- 1541 N Foxrun Terrace
- 4794 E Van Ness Rd
- 1563 N Foxrun Terrace
- 1529 N Foxrun Terrace
- 1571 N Foxrun Terrace
- 4772 E Van Ness Rd
- 1587 N Foxrun Terrace
- 4748 E Van Ness Rd
- 1523 N Foxrun Terrace
- 1530 N Foxrun Terrace
- 1599 N Foxrun Terrace
- 1560 N Foxrun Terrace
- 1570 N Foxrun Terrace
- 1344 N Timucuan Trail
- 1580 N Foxrun Terrace
- 1511 N Foxrun Terrace
Your Personal Tour Guide
Ask me questions while you tour the home.