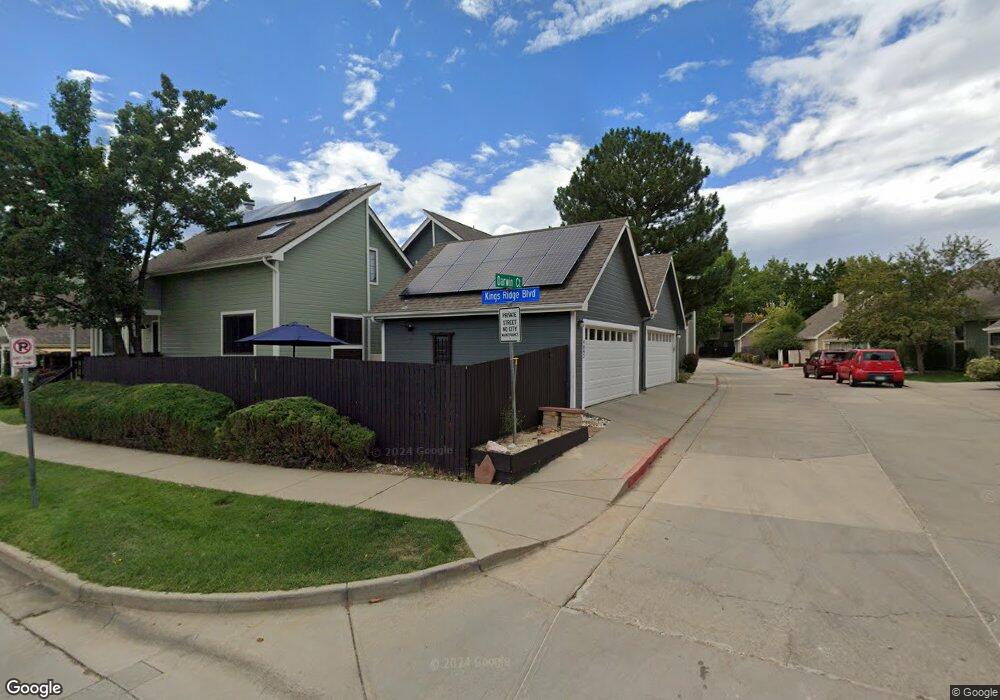
4884 Darwin Ct Boulder, CO 80301
Palo Park NeighborhoodEstimated Value: $643,000 - $751,000
3
Beds
3
Baths
2,007
Sq Ft
$340/Sq Ft
Est. Value
About This Home
This home is located at 4884 Darwin Ct, Boulder, CO 80301 and is currently estimated at $683,203, approximately $340 per square foot. 4884 Darwin Ct is a home located in Boulder County with nearby schools including Columbine Elementary School, Casey Middle School, and Boulder High School.
Ownership History
Date
Name
Owned For
Owner Type
Purchase Details
Closed on
Jun 27, 2017
Sold by
White Sally Joan
Bought by
Wolffe Sally Joan
Current Estimated Value
Purchase Details
Closed on
Jun 20, 2002
Sold by
Hickey Donna M
Bought by
White Sally J
Home Financials for this Owner
Home Financials are based on the most recent Mortgage that was taken out on this home.
Original Mortgage
$140,000
Interest Rate
6.82%
Purchase Details
Closed on
Mar 30, 1999
Sold by
Maryann Gold
Bought by
Hickey Donna M
Home Financials for this Owner
Home Financials are based on the most recent Mortgage that was taken out on this home.
Original Mortgage
$190,800
Interest Rate
6.82%
Mortgage Type
Balloon
Purchase Details
Closed on
Apr 11, 1989
Bought by
White Sally J
Purchase Details
Closed on
Dec 20, 1988
Bought by
White Sally J
Purchase Details
Closed on
Oct 21, 1987
Bought by
White Sally J
Create a Home Valuation Report for This Property
The Home Valuation Report is an in-depth analysis detailing your home's value as well as a comparison with similar homes in the area
Home Values in the Area
Average Home Value in this Area
Purchase History
| Date | Buyer | Sale Price | Title Company |
|---|---|---|---|
| Wolffe Sally Joan | -- | None Available | |
| White Sally J | $323,000 | Land Title | |
| Hickey Donna M | $212,000 | -- | |
| White Sally J | $108,800 | -- | |
| White Sally J | -- | -- | |
| White Sally J | -- | -- |
Source: Public Records
Mortgage History
| Date | Status | Borrower | Loan Amount |
|---|---|---|---|
| Previous Owner | White Sally J | $140,000 | |
| Previous Owner | Hickey Donna M | $190,800 |
Source: Public Records
Tax History
| Year | Tax Paid | Tax Assessment Tax Assessment Total Assessment is a certain percentage of the fair market value that is determined by local assessors to be the total taxable value of land and additions on the property. | Land | Improvement |
|---|---|---|---|---|
| 2025 | $3,615 | $48,063 | $18,700 | $29,363 |
| 2024 | $3,615 | $48,063 | $18,700 | $29,363 |
| 2023 | $3,553 | $47,838 | $20,046 | $31,477 |
| 2022 | $3,276 | $42,228 | $16,631 | $25,597 |
| 2021 | $3,124 | $43,443 | $17,110 | $26,333 |
| 2020 | $2,694 | $38,102 | $16,588 | $21,514 |
| 2019 | $2,653 | $38,102 | $16,588 | $21,514 |
| 2018 | $2,421 | $35,122 | $15,840 | $19,282 |
| 2017 | $2,345 | $38,829 | $17,512 | $21,317 |
| 2016 | $2,484 | $28,696 | $14,169 | $14,527 |
| 2015 | $2,352 | $24,772 | $4,378 | $20,394 |
| 2014 | $2,083 | $24,772 | $4,378 | $20,394 |
Source: Public Records
Map
Nearby Homes
- 4919 Noble Park Place
- 4855 Edison Ave Unit A
- 3074 Edison Ct
- 3119 Bell Dr
- 3135 Bell Dr
- 4848 Baldwin Place
- 4945 Tesla Cir
- 3284 Sentinel Dr
- 5000 Butte St Unit 208
- 5000 Butte St Unit 272
- 5000 Butte St Unit 202
- 5000 Butte St Unit 178
- 5000 Butte St Unit 142
- 3260 47th St Unit 108A
- 3327 Sentinel Dr
- 4855 Hopkins Place
- 3600 Hayden Place
- 3335 Talisman Ct Unit D
- 3355 Talisman Ct Unit C
- 3363 Oneal Pkwy Unit 35
Your Personal Tour Guide
Ask me questions while you tour the home.