Estimated Value: $223,000 - $262,110
4
Beds
2
Baths
1,800
Sq Ft
$134/Sq Ft
Est. Value
About This Home
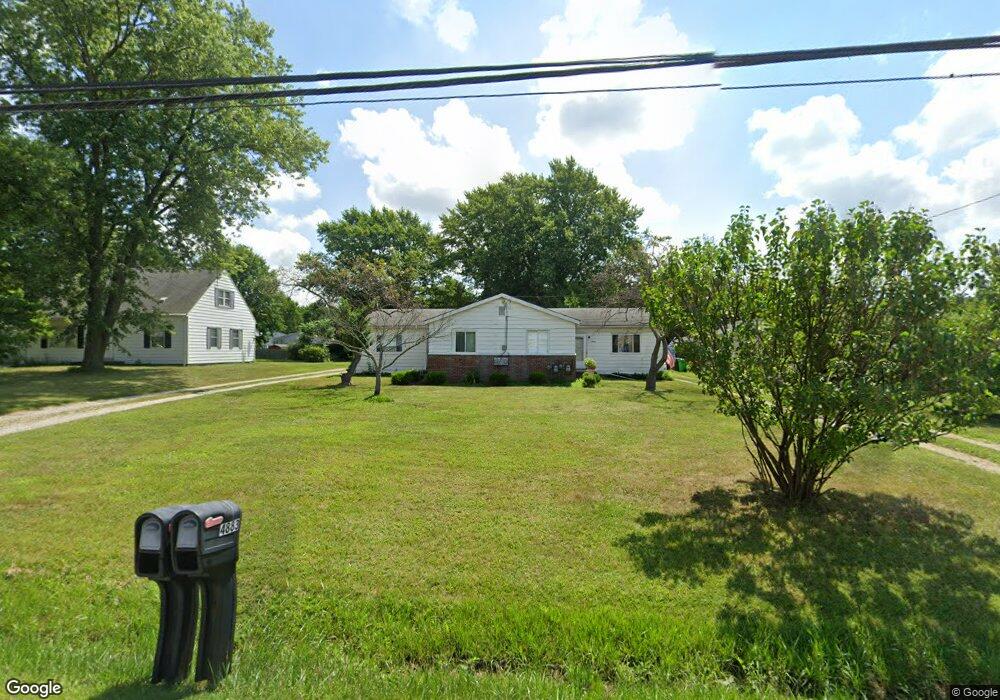
This home is located at 4885 Hudson Dr, Stow, OH 44224 and is currently estimated at $241,278, approximately $134 per square foot. 4885 Hudson Dr is a home located in Summit County with nearby schools including Stow-Munroe Falls High School, Primrose School of Hudson, and Cuyahoga Valley Christian Academy.
Ownership History
Date
Name
Owned For
Owner Type
Purchase Details
Closed on
May 28, 2008
Sold by
Wachovia Bank Na
Bought by
Vizmeg Robert D
Current Estimated Value
Home Financials for this Owner
Home Financials are based on the most recent Mortgage that was taken out on this home.
Original Mortgage
$93,500
Outstanding Balance
$59,999
Interest Rate
6.05%
Mortgage Type
Purchase Money Mortgage
Estimated Equity
$181,279
Purchase Details
Closed on
Mar 10, 2008
Sold by
Japps Denise F
Bought by
Wachovia Bank Na and The Securitized Asset Backed Receivables
Purchase Details
Closed on
Aug 30, 1999
Sold by
Amlung James R and Amlung Jacquelyn J
Bought by
Japps Plemel and Japps Denise F
Home Financials for this Owner
Home Financials are based on the most recent Mortgage that was taken out on this home.
Original Mortgage
$96,400
Interest Rate
7.59%
Create a Home Valuation Report for This Property
The Home Valuation Report is an in-depth analysis detailing your home's value as well as a comparison with similar homes in the area
Home Values in the Area
Average Home Value in this Area
Purchase History
| Date | Buyer | Sale Price | Title Company |
|---|---|---|---|
| Vizmeg Robert D | $110,000 | Resource Title Agency Inc | |
| Wachovia Bank Na | $105,000 | Attorney | |
| Japps Plemel | $105,000 | Approved Statewide Title Age |
Source: Public Records
Mortgage History
| Date | Status | Borrower | Loan Amount |
|---|---|---|---|
| Open | Vizmeg Robert D | $93,500 | |
| Previous Owner | Japps Plemel | $96,400 |
Source: Public Records
Tax History Compared to Growth
Tax History
| Year | Tax Paid | Tax Assessment Tax Assessment Total Assessment is a certain percentage of the fair market value that is determined by local assessors to be the total taxable value of land and additions on the property. | Land | Improvement |
|---|---|---|---|---|
| 2025 | $6,281 | $68,261 | $8,124 | $60,137 |
| 2024 | $4,054 | $68,261 | $8,124 | $60,137 |
| 2023 | $6,281 | $68,261 | $8,124 | $60,137 |
| 2022 | $3,762 | $55,826 | $6,605 | $49,221 |
| 2021 | $3,289 | $55,826 | $6,605 | $49,221 |
| 2020 | $3,371 | $56,470 | $7,250 | $49,220 |
| 2019 | $3,774 | $59,430 | $8,540 | $50,890 |
| 2018 | $3,716 | $59,430 | $8,540 | $50,890 |
| 2017 | $3,333 | $59,430 | $8,540 | $50,890 |
| 2016 | $3,376 | $52,320 | $8,540 | $43,780 |
| 2015 | $3,333 | $52,320 | $8,540 | $43,780 |
| 2014 | $3,336 | $52,320 | $8,540 | $43,780 |
| 2013 | $2,695 | $43,740 | $8,540 | $35,200 |
Source: Public Records
Map
Nearby Homes
- 1470 Mac Dr
- 1511 Apollo Dr
- 0 Hibbard Dr
- V/L Housley Rd
- V/L Lawnmark Dr
- 4877 Cedar Crest Ln
- 4891 Cedar Crest Ln
- 1525 Spruce Hill Dr
- 1808 Higby Dr Unit A
- 1664 Cypress Ct
- 1668 Cypress Ct
- 1627 Cypress Ct
- 1938 Higby Dr
- 4630 Red Willow Rd
- V/L Diplomat Dr
- 1620 Sapphire Dr
- 4321 Leewood Rd
- 4024 Glenrich Cir
- 1884 Village Ct Unit X66
- 5426 Port Chester Dr
- 4875 Hudson Dr Unit 4879
- 4887 Hudson Dr
- 4884 Algonquin Trail
- 4867 Hudson Dr Unit 4871
- 4876 Algonquin Trail
- 4859 Hudson Dr Unit 4863
- 4898 Algonquin Trail
- 4868 Algonquin Trail
- 4851 Hudson Dr Unit 4855
- 4906 Algonquin Trail
- 4860 Algonquin Trail
- 4887 Algonquin Trail
- 4899 Algonquin Trail
- 4877 Algonquin Trail
- 4843 Hudson Dr Unit 4847
- 4914 Algonquin Trail
- 4852 Algonquin Trail
- 4867 Algonquin Trail
- 4835 Hudson Dr Unit 4839
- 4835 4839 Hudson Dr