489 Blue Ridge Trails Morganton, GA 30560
Estimated Value: $540,004 - $728,000
Studio
3
Baths
2,310
Sq Ft
$274/Sq Ft
Est. Value
About This Home
This home is located at 489 Blue Ridge Trails, Morganton, GA 30560 and is currently estimated at $632,001, approximately $273 per square foot. 489 Blue Ridge Trails is a home located in Fannin County with nearby schools including Fannin County High School.
Ownership History
Date
Name
Owned For
Owner Type
Purchase Details
Closed on
Sep 20, 2024
Sold by
Margaret Ann Brayley Revocable Living Tr
Bought by
Schneider Karl and Schneider Sheila
Current Estimated Value
Purchase Details
Closed on
Sep 1, 2020
Sold by
Kliros Linda N
Bought by
Brayley Margaret Ann and Margaret Ann Brayley Rev Tr
Purchase Details
Closed on
Oct 11, 2019
Sold by
Casper Fredia A
Bought by
Kliros Linda N and Linda N Kliros Rev Liv Trust
Purchase Details
Closed on
Oct 20, 2016
Sold by
Hubbell Richard J and Hubbell Elizabeth N
Bought by
Casper Fredia A
Home Financials for this Owner
Home Financials are based on the most recent Mortgage that was taken out on this home.
Original Mortgage
$71,225
Interest Rate
3.5%
Mortgage Type
FHA
Purchase Details
Closed on
Jan 31, 1997
Sold by
Quintrell Roy
Bought by
Hubbell Richard J
Create a Home Valuation Report for This Property
The Home Valuation Report is an in-depth analysis detailing your home's value as well as a comparison with similar homes in the area
Home Values in the Area
Average Home Value in this Area
Purchase History
| Date | Buyer | Sale Price | Title Company |
|---|---|---|---|
| Schneider Karl | $500,000 | -- | |
| Brayley Margaret Ann | -- | -- | |
| Kliros Linda N | $339,500 | -- | |
| Casper Fredia A | $192,000 | -- | |
| Hubbell Richard J | $20,000 | -- |
Source: Public Records
Mortgage History
| Date | Status | Borrower | Loan Amount |
|---|---|---|---|
| Previous Owner | Casper Fredia A | $71,225 |
Source: Public Records
Tax History
| Year | Tax Paid | Tax Assessment Tax Assessment Total Assessment is a certain percentage of the fair market value that is determined by local assessors to be the total taxable value of land and additions on the property. | Land | Improvement |
|---|---|---|---|---|
| 2025 | $1,723 | $189,950 | $14,700 | $175,250 |
| 2024 | $9 | $147,633 | $14,700 | $132,933 |
| 2023 | $1,221 | $119,722 | $10,600 | $109,122 |
| 2022 | $1,551 | $152,126 | $10,600 | $141,526 |
| 2021 | $1,114 | $79,429 | $10,000 | $69,429 |
| 2020 | $1,101 | $79,429 | $10,000 | $69,429 |
| 2019 | $1,123 | $79,429 | $10,000 | $69,429 |
| 2018 | $1,190 | $79,429 | $10,000 | $69,429 |
| 2017 | $1,601 | $90,478 | $10,000 | $80,478 |
| 2016 | $1,384 | $81,475 | $10,000 | $71,475 |
| 2015 | $1,521 | $85,718 | $10,000 | $75,718 |
| 2014 | $1,417 | $91,043 | $16,000 | $75,043 |
| 2013 | -- | $85,190 | $16,000 | $69,190 |
Source: Public Records
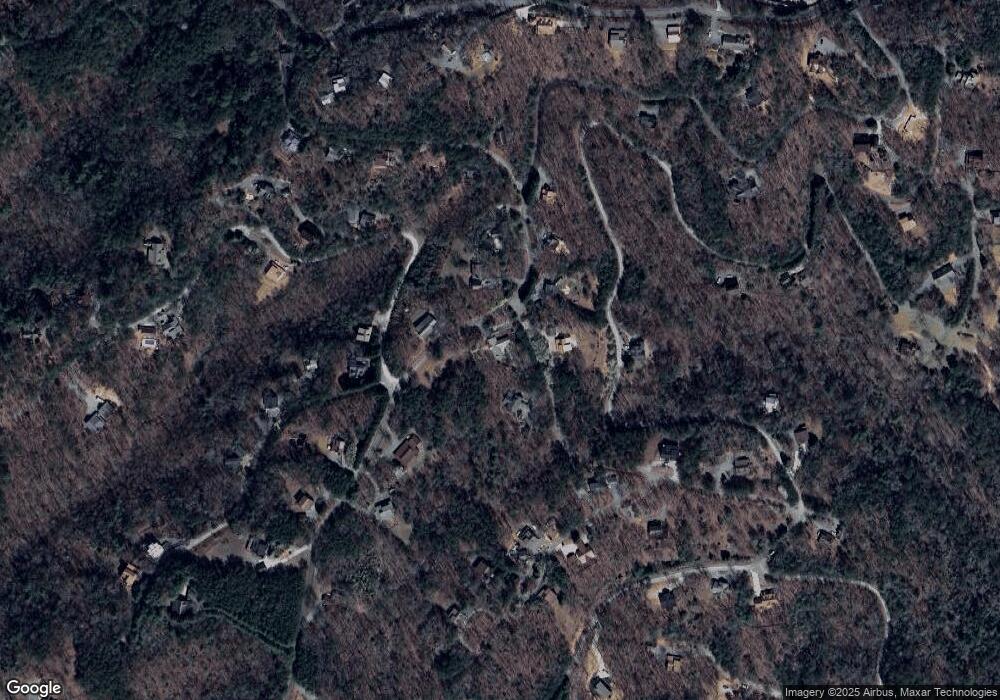
Map
Nearby Homes
- 34 Mountain Lookout
- 136 Mountain Meadows Cir
- Lot 144 Hideout Trail
- 91 Blue Grass Hollow
- 419 Blue Ridge Trail
- 290 Turkey Trot Rd
- 34 Smokey Ridge Ln
- 240 Rolling Hill
- LT 22 Rolling Hill Unit 22
- LT 22 Rolling Hill
- 161 Walkabout Creek Rd
- 171 Split Creek Rd
- LOT 95 The Ridges
- LT 151 The Ridges
- 529 Hidden Valley Dr
- 98 Ridgeview Rd
- 152 Cowboy Way
- 2454 Forge Mill Rd
- 7.93 Cutcane Rd
- 56.6 Ac Cutcane Rd
- 489 Blue Ridge Trail Unit 268
- 489 Blue Ridge Trail
- 58 Dolittle Rd
- 1.15 Acres Dolittle Rd
- LT272 Blue Ridge Trail
- Lot 272 Blue Ridge Trail Unit 272
- Lot 272 Blue Ridge Trail
- 510 Blue Ridge Trails
- 293 Winding Brook Trail
- 29 Dolittle Rd
- 29 Dolittle Rd Unit 255
- 453 Blue Ridge Trails
- 420 Blue Ridge Trails
- 420 Blue Ridge Trail
- 581 Blue Ridge Trails
- 41 Cabbage Patch Rd Unit 283A
- 41 Cabbage Patch Rd
- 17 Cabbage Patch Rd
- 394 Blue Ridge Trail
- 80 Lobo Trail
Your Personal Tour Guide
Ask me questions while you tour the home.