Estimated Value: $512,483 - $581,000
5
Beds
2
Baths
2,321
Sq Ft
$238/Sq Ft
Est. Value
About This Home
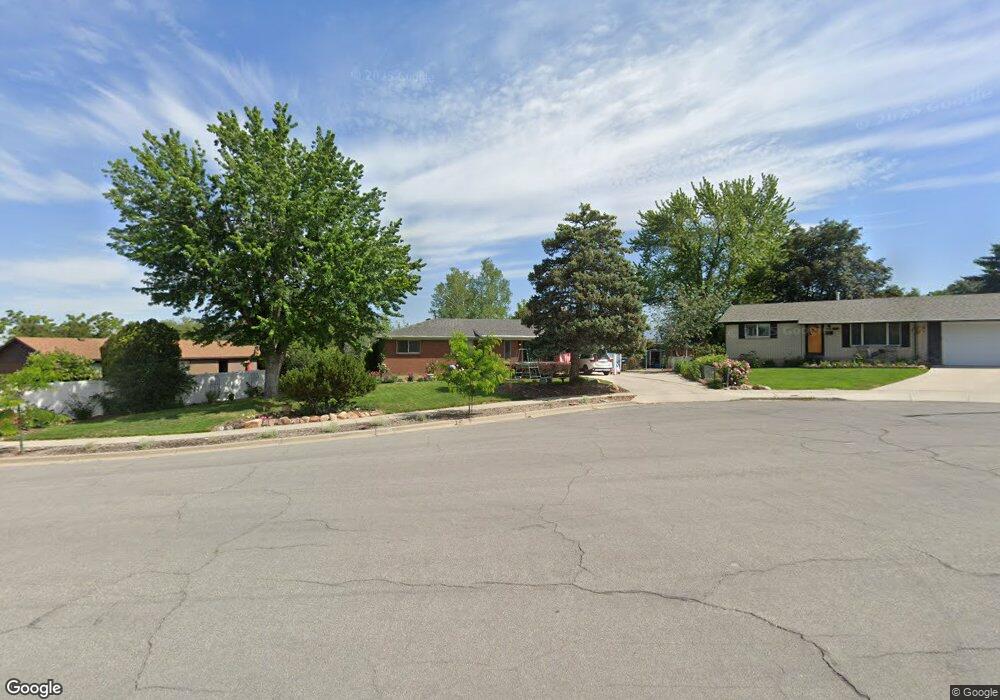
This home is located at 489 E Paty Cir, Sandy, UT 84070 and is currently estimated at $552,121, approximately $237 per square foot. 489 E Paty Cir is a home located in Salt Lake County with nearby schools including Midvalley Elementary School, Union Middle School, and Hillcrest High School.
Ownership History
Date
Name
Owned For
Owner Type
Purchase Details
Closed on
Jul 22, 2019
Sold by
Olsen Leon G and Harris Michelle
Bought by
Gunner Kellen Richards and Gunner Olivia Clare
Current Estimated Value
Home Financials for this Owner
Home Financials are based on the most recent Mortgage that was taken out on this home.
Original Mortgage
$260,720
Outstanding Balance
$228,414
Interest Rate
3.82%
Mortgage Type
New Conventional
Estimated Equity
$323,707
Purchase Details
Closed on
Jun 15, 2018
Sold by
Olsen Leon G
Bought by
Olsen Leon G and Harris Michelle
Create a Home Valuation Report for This Property
The Home Valuation Report is an in-depth analysis detailing your home's value as well as a comparison with similar homes in the area
Home Values in the Area
Average Home Value in this Area
Purchase History
| Date | Buyer | Sale Price | Title Company |
|---|---|---|---|
| Gunner Kellen Richards | -- | Surety Title | |
| Olsen Leon G | -- | Surety Title | |
| Olsen Leon G | -- | Accommodation |
Source: Public Records
Mortgage History
| Date | Status | Borrower | Loan Amount |
|---|---|---|---|
| Open | Gunner Kellen Richards | $260,720 |
Source: Public Records
Tax History
| Year | Tax Paid | Tax Assessment Tax Assessment Total Assessment is a certain percentage of the fair market value that is determined by local assessors to be the total taxable value of land and additions on the property. | Land | Improvement |
|---|---|---|---|---|
| 2025 | $2,541 | $478,500 | $128,500 | $350,000 |
| 2024 | $2,541 | $469,300 | $120,800 | $348,500 |
| 2023 | $2,349 | $432,800 | $114,800 | $318,000 |
| 2022 | $2,472 | $445,400 | $112,600 | $332,800 |
| 2021 | $2,232 | $341,600 | $97,900 | $243,700 |
| 2020 | $2,116 | $305,600 | $79,300 | $226,300 |
| 2019 | $1,812 | $254,900 | $79,300 | $175,600 |
| 2016 | $1,510 | $204,400 | $70,500 | $133,900 |
Source: Public Records
Map
Nearby Homes
- 393 E Corral Creek Dr
- 379 E Horse Creek Dr
- 8087 S 615 E
- 397 E Tractor Dr Unit 103
- 274 E Water Mill Way Unit 230
- 257 Water Mill Way Unit 211
- 257 E Water Mill Way
- 7869 S 700 E
- 7824 S 280 E
- 8322 S Levine Ln Unit 111
- 8023 S Pinewood Dr
- 760 E 8080 S
- 190 E White Spruce Cove Unit 805
- 600 E Briarsprings Cir
- 359 E 8400 S
- 135 E Station St
- 798 E Spruce Tree Ln
- 354 E 7635 South St
- 350 E 7635 South St
- 330 E 7635 S Unit 344
Your Personal Tour Guide
Ask me questions while you tour the home.