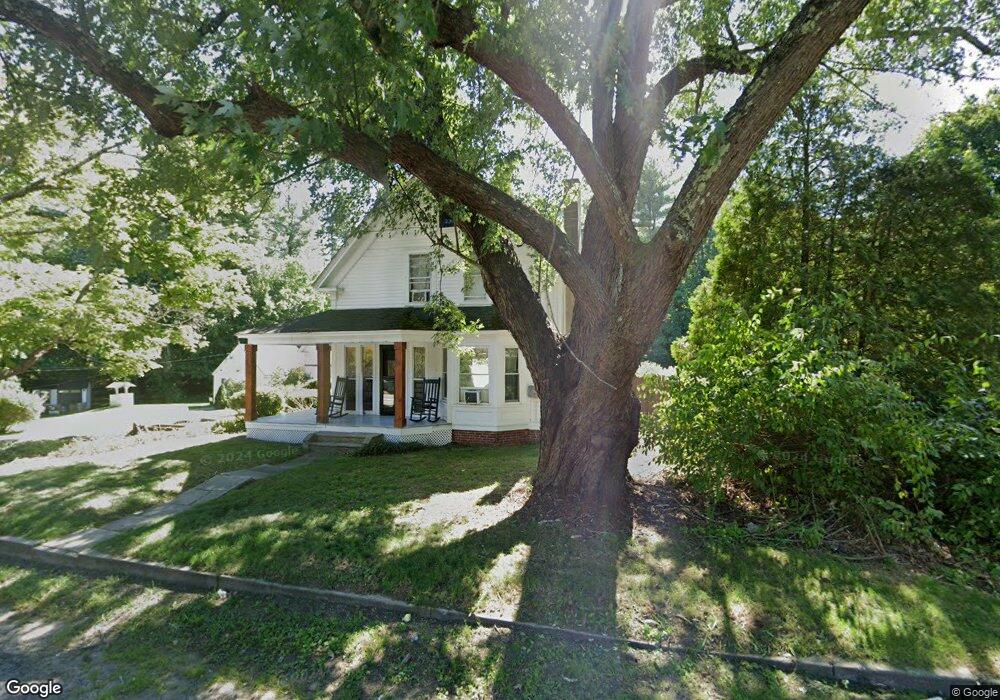
489 Main St Fremont, NH 03044
Estimated Value: $593,000 - $636,000
2
Beds
2
Baths
2,283
Sq Ft
$265/Sq Ft
Est. Value
About This Home
This home is located at 489 Main St, Fremont, NH 03044 and is currently estimated at $605,086, approximately $265 per square foot. 489 Main St is a home located in Rockingham County with nearby schools including Ellis School.
Ownership History
Date
Name
Owned For
Owner Type
Purchase Details
Closed on
May 26, 2021
Sold by
Marric Rt
Bought by
Watson Kevin A and Watson Erin M
Current Estimated Value
Home Financials for this Owner
Home Financials are based on the most recent Mortgage that was taken out on this home.
Original Mortgage
$305,250
Outstanding Balance
$276,795
Interest Rate
3%
Mortgage Type
FHA
Estimated Equity
$328,291
Purchase Details
Closed on
Nov 17, 2000
Sold by
Buhrman Charles S and Buhrman Maureen L
Bought by
Pinder Richard J
Home Financials for this Owner
Home Financials are based on the most recent Mortgage that was taken out on this home.
Original Mortgage
$150,000
Interest Rate
7.78%
Create a Home Valuation Report for This Property
The Home Valuation Report is an in-depth analysis detailing your home's value as well as a comparison with similar homes in the area
Home Values in the Area
Average Home Value in this Area
Purchase History
| Date | Buyer | Sale Price | Title Company |
|---|---|---|---|
| Watson Kevin A | $430,000 | None Available | |
| Pinder Richard J | $279,000 | -- |
Source: Public Records
Mortgage History
| Date | Status | Borrower | Loan Amount |
|---|---|---|---|
| Open | Watson Kevin A | $305,250 | |
| Previous Owner | Pinder Richard J | $100,000 | |
| Previous Owner | Pinder Richard J | $150,000 |
Source: Public Records
Tax History Compared to Growth
Tax History
| Year | Tax Paid | Tax Assessment Tax Assessment Total Assessment is a certain percentage of the fair market value that is determined by local assessors to be the total taxable value of land and additions on the property. | Land | Improvement |
|---|---|---|---|---|
| 2024 | $7,666 | $290,700 | $90,200 | $200,500 |
| 2023 | $6,858 | $290,700 | $90,200 | $200,500 |
| 2022 | $6,741 | $290,700 | $90,200 | $200,500 |
| 2021 | $6,509 | $291,600 | $90,200 | $201,400 |
| 2020 | $6,745 | $291,600 | $90,200 | $201,400 |
| 2019 | $7,284 | $234,600 | $76,800 | $157,800 |
| 2018 | $23,525 | $238,400 | $76,800 | $161,600 |
| 2017 | $22,922 | $238,400 | $76,800 | $161,600 |
| 2016 | $7,123 | $238,400 | $76,800 | $161,600 |
| 2015 | $6,914 | $238,400 | $76,800 | $161,600 |
| 2014 | $6,516 | $230,900 | $76,800 | $154,100 |
| 2013 | $6,583 | $230,900 | $76,800 | $154,100 |
Source: Public Records
Map
Nearby Homes
- 454 Main St
- 564 Main St
- 40 Louise Ln
- 54 Cavil Mill Rd
- 292 Main St
- 98 Copp Dr
- 705 Main St
- 16 Currier Ln
- 45 Whittier Dr
- Lot 7-3 Sanborn Meadow Unit 7-3
- Lot 7-0 Sanborn Meadow Unit 7-0
- Lot 7-2 Sanborn Meadow Unit 7-2
- 37 Walker Ln
- 118 Hall Rd Unit 3
- 8 Taylor Cir Unit 12
- 12 Tarah Way
- 84 Sandown Rd
- 70 Sandown Rd
- 24 Rim Rd
- 12 Hub Hollow Rd