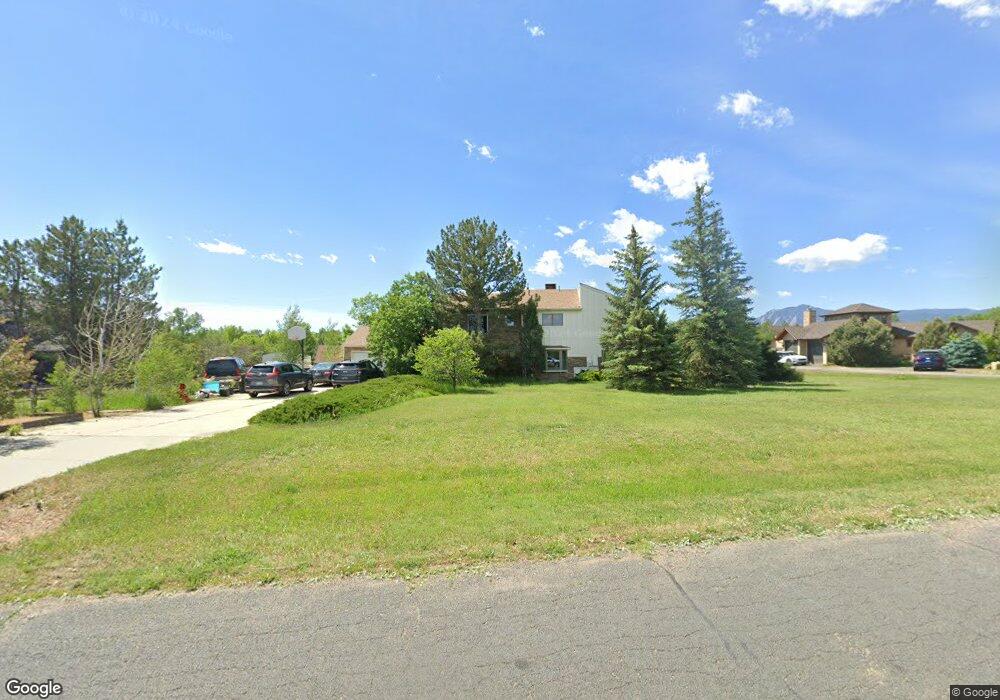
4892 Valhalla Dr Boulder, CO 80301
Estimated Value: $1,377,285 - $2,053,000
3
Beds
3
Baths
2,504
Sq Ft
$701/Sq Ft
Est. Value
About This Home
This home is located at 4892 Valhalla Dr, Boulder, CO 80301 and is currently estimated at $1,754,071, approximately $700 per square foot. 4892 Valhalla Dr is a home located in Boulder County with nearby schools including Crest View Elementary School, Centennial Middle School, and Boulder High School.
Ownership History
Date
Name
Owned For
Owner Type
Purchase Details
Closed on
Nov 13, 1984
Bought by
Painter Sabine B
Current Estimated Value
Purchase Details
Closed on
Aug 23, 1984
Bought by
Painter Sabine B
Purchase Details
Closed on
Feb 10, 1983
Bought by
Painter Sabine B
Create a Home Valuation Report for This Property
The Home Valuation Report is an in-depth analysis detailing your home's value as well as a comparison with similar homes in the area
Purchase History
| Date | Buyer | Sale Price | Title Company |
|---|---|---|---|
| Painter Sabine B | $49,000 | -- | |
| Painter Sabine B | $37,500 | -- | |
| Painter Sabine B | $40,000 | -- |
Source: Public Records
Tax History
| Year | Tax Paid | Tax Assessment Tax Assessment Total Assessment is a certain percentage of the fair market value that is determined by local assessors to be the total taxable value of land and additions on the property. | Land | Improvement |
|---|---|---|---|---|
| 2025 | $7,384 | $75,325 | $32,000 | $43,325 |
| 2024 | $7,384 | $75,325 | $32,000 | $43,325 |
| 2023 | $7,262 | $86,618 | $23,845 | $66,457 |
| 2022 | $5,831 | $66,741 | $19,182 | $47,559 |
| 2021 | $5,559 | $68,661 | $19,734 | $48,927 |
| 2020 | $4,163 | $52,632 | $20,521 | $32,111 |
| 2019 | $4,100 | $52,632 | $20,521 | $32,111 |
| 2018 | $4,491 | $56,513 | $21,024 | $35,489 |
| 2017 | $4,989 | $62,478 | $23,243 | $39,235 |
| 2016 | $4,986 | $54,853 | $19,343 | $35,510 |
| 2015 | $4,734 | $47,425 | $24,039 | $23,386 |
| 2014 | $4,606 | $47,425 | $24,039 | $23,386 |
Source: Public Records
Map
Nearby Homes
- 4963 Kelso Rd
- 4410 51st St
- 5511 Pioneer Rd
- 5588 Pioneer Rd
- 4490 Clay St
- 4556 Apple Way
- 4190 Longview Ln
- 4591 Sunnyside Place Unit D
- 5904 Gunbarrel Ave Unit B
- 5914 Gunbarrel Ave Unit F
- 5920 Gunbarrel Ave Unit D
- 5922 Gunbarrel Ave Unit F
- 5865 N Orchard Creek Cir
- 4150 Longview Ln
- 4705 Spine Rd Unit C
- 4125 47th St Unit C
- 4725 Spine Rd Unit F
- 5932 Gunbarrel Ave Unit E
- 4741 White Rock Cir Unit C
- 4650 White Rock Cir Unit 12
- 4878 Valhalla Dr
- 4924 Valhalla Dr
- 4948 Valhalla Dr
- 4889 Valhalla Dr
- 4856 Valhalla Dr
- 4937 Valkyrie Dr
- 4925 Valkyrie Dr
- 4867 Valhalla Dr
- 4935 Valhalla Dr
- 4966 Valhalla Dr
- 4961 Valkyrie Dr
- 4824 Valhalla Dr
- 4913 Valkyrie Dr
- 4979 Valkyrie Dr
- 4990 Valhalla Dr
- 4981 Valhalla Dr
- 5231 Thor Ave
- 4798 Valhalla Dr
- 4833 Valhalla Dr
- 4899 Valkyrie Dr
Your Personal Tour Guide
Ask me questions while you tour the home.