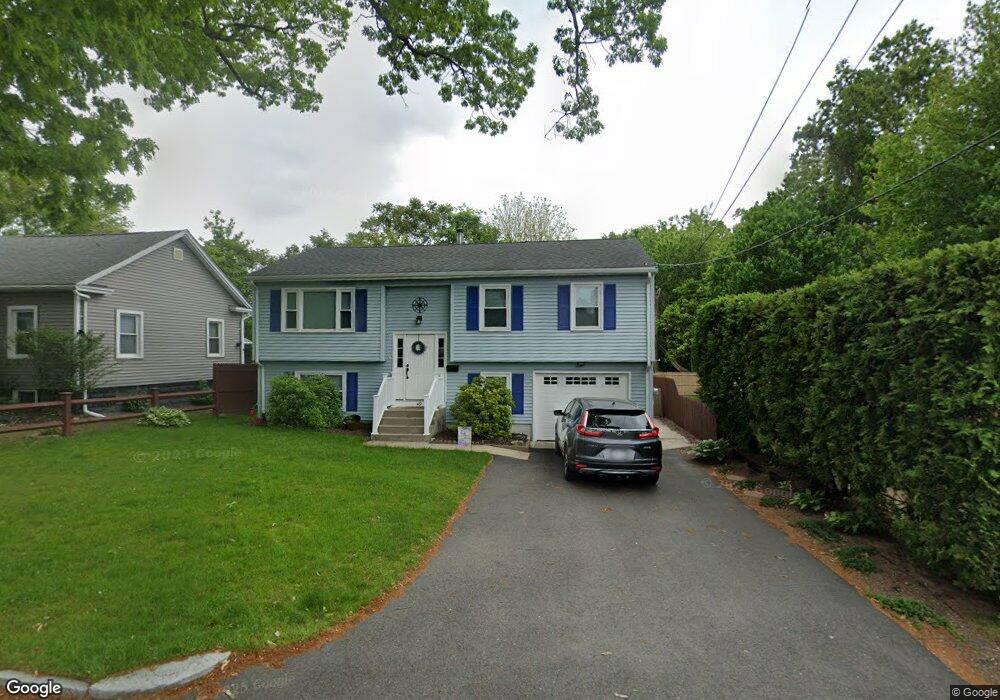
49 Agnes St Springfield, MA 01118
East Forest Park NeighborhoodEstimated Value: $294,335 - $312,000
3
Beds
1
Bath
1,034
Sq Ft
$294/Sq Ft
Est. Value
About This Home
This home is located at 49 Agnes St, Springfield, MA 01118 and is currently estimated at $304,084, approximately $294 per square foot. 49 Agnes St is a home located in Hampden County with nearby schools including Mary A. Dryden Veterans Memorial School, M Marcus Kiley Middle, and Springfield High School of Science and Technology.
Ownership History
Date
Name
Owned For
Owner Type
Purchase Details
Closed on
May 18, 2001
Sold by
Fhlmc
Bought by
Rivera Yesenia and Rivera Frankie J
Current Estimated Value
Home Financials for this Owner
Home Financials are based on the most recent Mortgage that was taken out on this home.
Original Mortgage
$80,700
Outstanding Balance
$30,133
Interest Rate
7.03%
Mortgage Type
Purchase Money Mortgage
Estimated Equity
$273,951
Purchase Details
Closed on
Jan 10, 2001
Sold by
Cote Richard A and Cote Arlene M
Bought by
Fhlmc
Purchase Details
Closed on
Jul 17, 1992
Sold by
Rugani Bruce A and Rugani Diana M
Bought by
Cote Richard A and Cote Arlene M
Home Financials for this Owner
Home Financials are based on the most recent Mortgage that was taken out on this home.
Original Mortgage
$82,650
Interest Rate
8.54%
Mortgage Type
Purchase Money Mortgage
Create a Home Valuation Report for This Property
The Home Valuation Report is an in-depth analysis detailing your home's value as well as a comparison with similar homes in the area
Home Values in the Area
Average Home Value in this Area
Purchase History
| Date | Buyer | Sale Price | Title Company |
|---|---|---|---|
| Rivera Yesenia | $85,000 | -- | |
| Fhlmc | $91,558 | -- | |
| Cote Richard A | $87,000 | -- |
Source: Public Records
Mortgage History
| Date | Status | Borrower | Loan Amount |
|---|---|---|---|
| Open | Cote Richard A | $80,700 | |
| Previous Owner | Cote Richard A | $82,650 |
Source: Public Records
Tax History
| Year | Tax Paid | Tax Assessment Tax Assessment Total Assessment is a certain percentage of the fair market value that is determined by local assessors to be the total taxable value of land and additions on the property. | Land | Improvement |
|---|---|---|---|---|
| 2025 | $4,309 | $274,800 | $45,200 | $229,600 |
| 2024 | $3,769 | $234,700 | $45,200 | $189,500 |
| 2023 | $3,957 | $232,100 | $43,100 | $189,000 |
| 2022 | $3,557 | $189,000 | $43,100 | $145,900 |
| 2021 | $3,410 | $180,400 | $39,200 | $141,200 |
| 2020 | $3,172 | $162,400 | $39,200 | $123,200 |
| 2019 | $2,970 | $150,900 | $39,200 | $111,700 |
| 2018 | $2,911 | $147,900 | $39,200 | $108,700 |
| 2017 | $3,002 | $152,700 | $39,200 | $113,500 |
| 2016 | $2,418 | $123,000 | $39,200 | $83,800 |
| 2015 | $2,410 | $122,500 | $39,200 | $83,300 |
Source: Public Records
Map
Nearby Homes
Your Personal Tour Guide
Ask me questions while you tour the home.