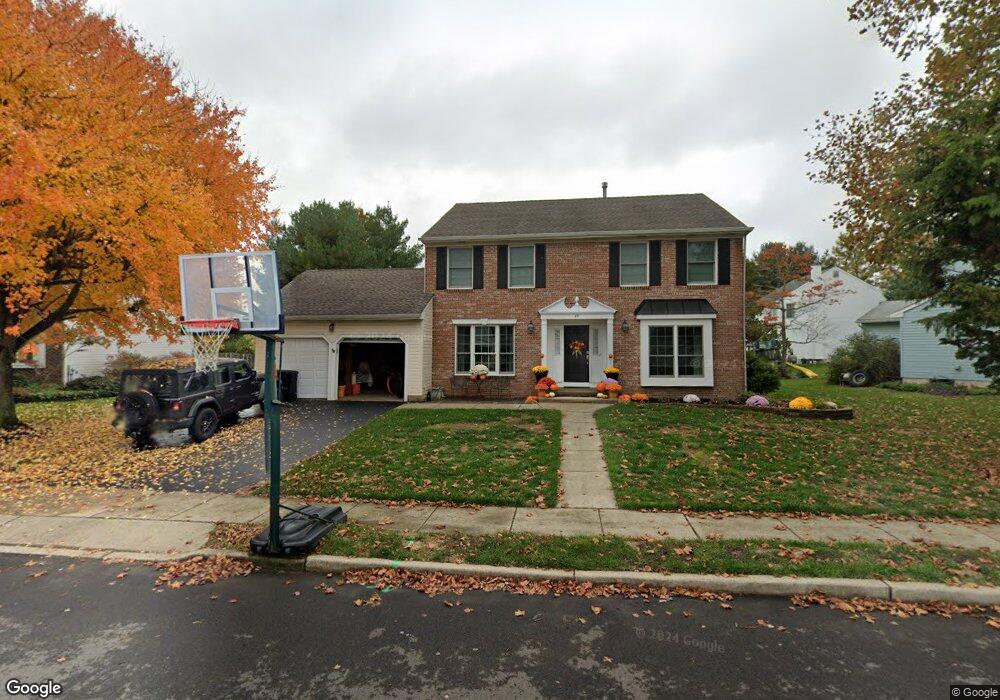
49 Brook Dr Burlington, NJ 08016
Estimated Value: $567,000 - $603,000
--
Bed
--
Bath
2,578
Sq Ft
$226/Sq Ft
Est. Value
About This Home
This home is located at 49 Brook Dr, Burlington, NJ 08016 and is currently estimated at $582,242, approximately $225 per square foot. 49 Brook Dr is a home located in Burlington County with nearby schools including B Bernice Young Elementary School, Fountain Woods Elementary School, and Burlington Township Middle School at Springside.
Ownership History
Date
Name
Owned For
Owner Type
Purchase Details
Closed on
Jan 1, 2017
Sold by
Smith Nakia T
Bought by
Smith Jason R
Current Estimated Value
Purchase Details
Closed on
Mar 31, 2008
Sold by
Whelan Richard and Whelan Jacqueline
Bought by
Ent Christopher and Ent Tracey
Home Financials for this Owner
Home Financials are based on the most recent Mortgage that was taken out on this home.
Original Mortgage
$288,000
Outstanding Balance
$185,552
Interest Rate
6.3%
Mortgage Type
Purchase Money Mortgage
Estimated Equity
$396,690
Purchase Details
Closed on
Jul 30, 2001
Sold by
Goldberg Steve J and Goldberg Dena M
Bought by
Smith Jason R
Create a Home Valuation Report for This Property
The Home Valuation Report is an in-depth analysis detailing your home's value as well as a comparison with similar homes in the area
Home Values in the Area
Average Home Value in this Area
Purchase History
| Date | Buyer | Sale Price | Title Company |
|---|---|---|---|
| Smith Jason R | -- | None Available | |
| Ent Christopher | $360,000 | Fidelity Natl Title Ins Co | |
| Smith Jason R | $255,000 | Collegiate Title Corp |
Source: Public Records
Mortgage History
| Date | Status | Borrower | Loan Amount |
|---|---|---|---|
| Open | Ent Christopher | $288,000 |
Source: Public Records
Tax History Compared to Growth
Tax History
| Year | Tax Paid | Tax Assessment Tax Assessment Total Assessment is a certain percentage of the fair market value that is determined by local assessors to be the total taxable value of land and additions on the property. | Land | Improvement |
|---|---|---|---|---|
| 2025 | $9,141 | $301,500 | $76,000 | $225,500 |
| 2024 | $9,006 | $301,500 | $76,000 | $225,500 |
| 2023 | $9,006 | $301,500 | $76,000 | $225,500 |
| 2022 | $8,967 | $301,500 | $76,000 | $225,500 |
| 2021 | $9,057 | $301,500 | $76,000 | $225,500 |
| 2020 | $9,036 | $301,500 | $76,000 | $225,500 |
| 2019 | $9,057 | $301,500 | $76,000 | $225,500 |
| 2018 | $8,921 | $301,500 | $76,000 | $225,500 |
| 2017 | $8,867 | $301,500 | $76,000 | $225,500 |
| 2016 | $9,000 | $300,000 | $90,400 | $209,600 |
| 2015 | $8,844 | $300,000 | $90,400 | $209,600 |
| 2014 | $8,520 | $300,000 | $90,400 | $209,600 |
Source: Public Records
Map
Nearby Homes