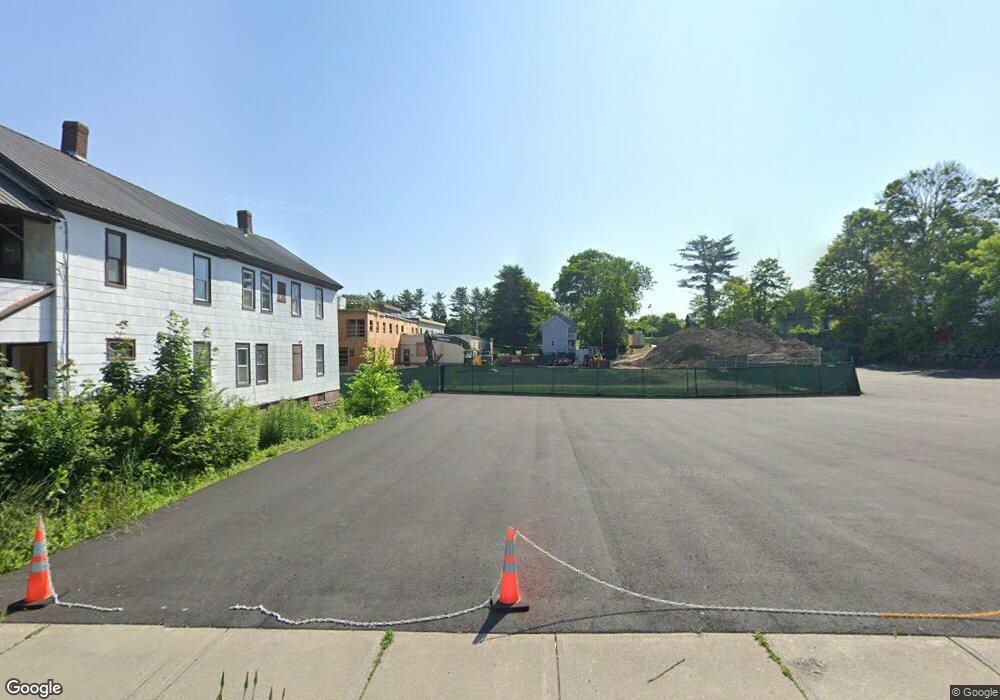
49 Conway St Greenfield, MA 01301
Estimated Value: $80,000 - $238,000
11
Beds
7
Baths
4,811
Sq Ft
$32/Sq Ft
Est. Value
About This Home
This home is located at 49 Conway St, Greenfield, MA 01301 and is currently estimated at $153,333, approximately $31 per square foot. 49 Conway St is a home located in Franklin County with nearby schools including Four Rivers Charter Public School and Cornerstone Christian School.
Ownership History
Date
Name
Owned For
Owner Type
Purchase Details
Closed on
Feb 1, 2022
Sold by
Dillon James J and Dillon Thomas A
Bought by
Mag Re Hldg Greenfield
Current Estimated Value
Purchase Details
Closed on
Jul 25, 2019
Sold by
Burrell Theodore J
Bought by
Dillon Thomas A and Dillon James J
Purchase Details
Closed on
Aug 1, 1994
Sold by
Carlsen Catherine I
Bought by
Burrell Theodore J
Create a Home Valuation Report for This Property
The Home Valuation Report is an in-depth analysis detailing your home's value as well as a comparison with similar homes in the area
Home Values in the Area
Average Home Value in this Area
Purchase History
| Date | Buyer | Sale Price | Title Company |
|---|---|---|---|
| Mag Re Hldg Greenfield | $2,050,000 | None Available | |
| Mag Re Hldg Greenfield | $2,050,000 | None Available | |
| Dillon Thomas A | $19,000 | -- | |
| Dillon Thomas A | $19,000 | -- | |
| Burrell Theodore J | $76,000 | -- | |
| Burrell Theodore J | $76,000 | -- |
Source: Public Records
Mortgage History
| Date | Status | Borrower | Loan Amount |
|---|---|---|---|
| Previous Owner | Burrell Theodore J | $198,135 | |
| Previous Owner | Burrell Theodore J | $140,000 | |
| Previous Owner | Burrell Theodore J | $127,296 |
Source: Public Records
Tax History Compared to Growth
Tax History
| Year | Tax Paid | Tax Assessment Tax Assessment Total Assessment is a certain percentage of the fair market value that is determined by local assessors to be the total taxable value of land and additions on the property. | Land | Improvement |
|---|---|---|---|---|
| 2025 | $898 | $45,900 | $45,900 | $0 |
| 2024 | $854 | $41,900 | $41,900 | $0 |
| 2023 | $823 | $41,900 | $41,900 | $0 |
| 2022 | $891 | $39,900 | $39,900 | $0 |
| 2021 | $996 | $42,900 | $42,900 | $0 |
| 2020 | $1,360 | $59,300 | $38,900 | $20,400 |
| 2019 | $2,768 | $123,800 | $33,900 | $89,900 |
| 2018 | $2,712 | $120,900 | $33,200 | $87,700 |
| 2017 | $2,627 | $120,900 | $33,200 | $87,700 |
| 2016 | $6,172 | $283,000 | $28,900 | $254,100 |
| 2015 | $5,936 | $263,700 | $29,200 | $234,500 |
| 2014 | $5,418 | $263,900 | $29,200 | $234,700 |
Source: Public Records
Map
Nearby Homes