Estimated Value: $2,098,000 - $3,367,000
5
Beds
5
Baths
4,813
Sq Ft
$508/Sq Ft
Est. Value
About This Home
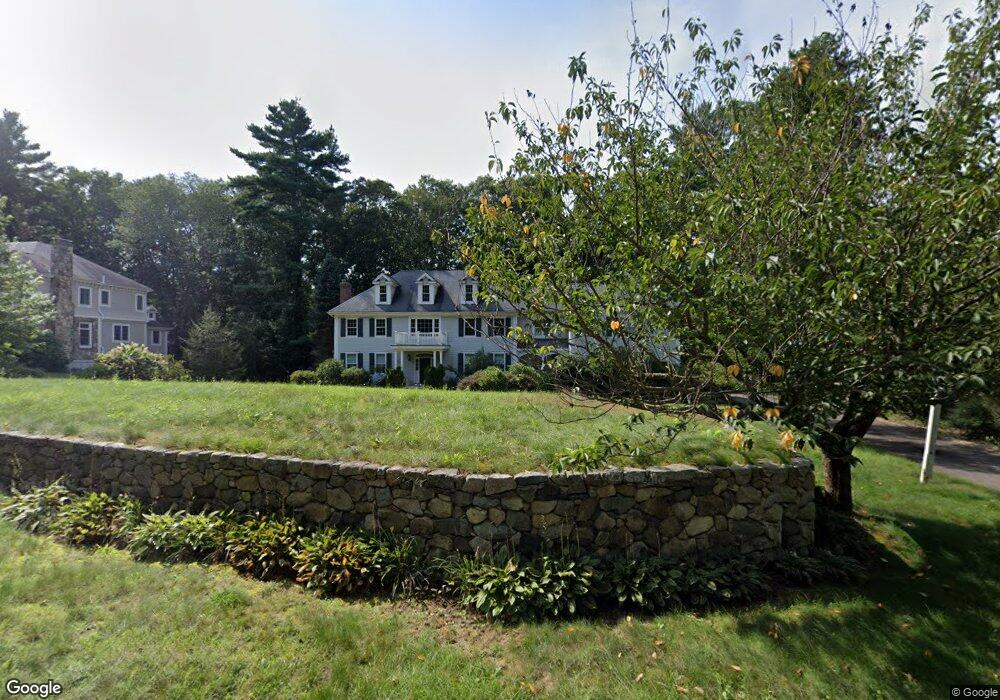
This home is located at 49 Draper Rd, Dover, MA 02030 and is currently estimated at $2,446,213, approximately $508 per square foot. 49 Draper Rd is a home located in Norfolk County with nearby schools including Chickering Elementary School, Dover-Sherborn Regional Middle School, and Dover-Sherborn Regional High School.
Ownership History
Date
Name
Owned For
Owner Type
Purchase Details
Closed on
Dec 17, 2010
Sold by
Hitchings James M and Hitchings Peggy D
Bought by
Kim Samuel S and Lee Hye Seung
Current Estimated Value
Home Financials for this Owner
Home Financials are based on the most recent Mortgage that was taken out on this home.
Original Mortgage
$1,000,000
Outstanding Balance
$653,256
Interest Rate
4.23%
Mortgage Type
Purchase Money Mortgage
Estimated Equity
$1,792,957
Purchase Details
Closed on
Sep 12, 2003
Sold by
Harrison Rt and Brown Dennis R
Bought by
Hitchins James M and Hitchins Peggy
Home Financials for this Owner
Home Financials are based on the most recent Mortgage that was taken out on this home.
Original Mortgage
$100,000
Interest Rate
6.43%
Create a Home Valuation Report for This Property
The Home Valuation Report is an in-depth analysis detailing your home's value as well as a comparison with similar homes in the area
Home Values in the Area
Average Home Value in this Area
Purchase History
| Date | Buyer | Sale Price | Title Company |
|---|---|---|---|
| Kim Samuel S | $1,350,000 | -- | |
| Hitchins James M | $1,510,000 | -- |
Source: Public Records
Mortgage History
| Date | Status | Borrower | Loan Amount |
|---|---|---|---|
| Open | Kim Samuel S | $1,000,000 | |
| Previous Owner | Hitchins James M | $100,000 | |
| Previous Owner | Hitchins James M | $675,000 | |
| Previous Owner | Hitchins James M | $260,000 |
Source: Public Records
Tax History
| Year | Tax Paid | Tax Assessment Tax Assessment Total Assessment is a certain percentage of the fair market value that is determined by local assessors to be the total taxable value of land and additions on the property. | Land | Improvement |
|---|---|---|---|---|
| 2025 | $23,096 | $2,049,300 | $664,700 | $1,384,600 |
| 2024 | $21,223 | $1,936,400 | $664,700 | $1,271,700 |
| 2023 | $20,171 | $1,654,700 | $544,900 | $1,109,800 |
| 2022 | $18,664 | $1,502,700 | $523,100 | $979,600 |
| 2021 | $18,897 | $1,466,000 | $523,100 | $942,900 |
| 2020 | $18,823 | $1,466,000 | $523,100 | $942,900 |
| 2019 | $18,955 | $1,466,000 | $523,100 | $942,900 |
| 2018 | $18,683 | $1,455,100 | $518,800 | $936,300 |
| 2017 | $19,362 | $1,483,700 | $518,800 | $964,900 |
| 2016 | $18,885 | $1,466,200 | $501,300 | $964,900 |
| 2015 | $18,233 | $1,435,700 | $470,800 | $964,900 |
Source: Public Records
Map
Nearby Homes
Your Personal Tour Guide
Ask me questions while you tour the home.