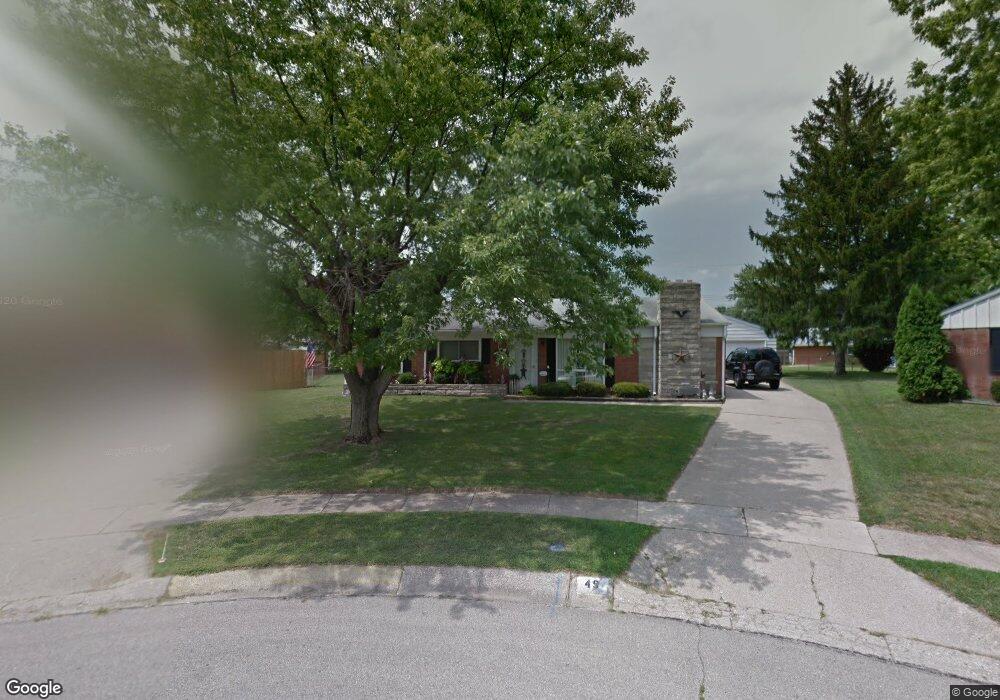
49 Dwinell Ct Franklin, OH 45005
Estimated Value: $206,000 - $214,000
3
Beds
1
Bath
1,250
Sq Ft
$167/Sq Ft
Est. Value
About This Home
This home is located at 49 Dwinell Ct, Franklin, OH 45005 and is currently estimated at $208,289, approximately $166 per square foot. 49 Dwinell Ct is a home located in Warren County with nearby schools including Franklin High School and The CinDay Academy.
Create a Home Valuation Report for This Property
The Home Valuation Report is an in-depth analysis detailing your home's value as well as a comparison with similar homes in the area
Home Values in the Area
Average Home Value in this Area
Tax History
| Year | Tax Paid | Tax Assessment Tax Assessment Total Assessment is a certain percentage of the fair market value that is determined by local assessors to be the total taxable value of land and additions on the property. | Land | Improvement |
|---|---|---|---|---|
| 2025 | $2,662 | $56,600 | $15,750 | $40,850 |
| 2024 | $2,662 | $56,600 | $15,750 | $40,850 |
| 2023 | $1,768 | $42,346 | $9,684 | $32,662 |
| 2022 | $1,734 | $42,347 | $9,685 | $32,662 |
| 2021 | $1,644 | $42,347 | $9,685 | $32,662 |
| 2020 | $1,427 | $34,430 | $7,875 | $26,555 |
| 2019 | $1,298 | $34,430 | $7,875 | $26,555 |
| 2018 | $1,301 | $34,430 | $7,875 | $26,555 |
| 2017 | $1,300 | $32,249 | $7,480 | $24,770 |
| 2016 | $1,326 | $32,249 | $7,480 | $24,770 |
| 2015 | $663 | $32,249 | $7,480 | $24,770 |
| 2014 | $680 | $32,250 | $7,480 | $24,770 |
| 2013 | $1,147 | $37,720 | $8,750 | $28,970 |
Source: Public Records
Map
Nearby Homes
- 747 David Blvd
- 760 David Blvd
- 21 Skokiaan Dr
- 409 Millard Dr
- 551 E 2nd St
- 11 Highridge Ct
- 165 Elaine Dr
- 0 Victoria Dr Unit 942075
- 0 Victoria Dr Unit 1852824
- 202 E 2nd St
- 812 Victoria Dr
- 995 E 4th St
- 5 S River St
- 228 Bridge St
- 45 W 3rd St
- 0 E 4th St
- 205 Oxford Rd
- 527 S Main St
- 309 Oxford Rd
- 218 Roberts Ave
Your Personal Tour Guide
Ask me questions while you tour the home.