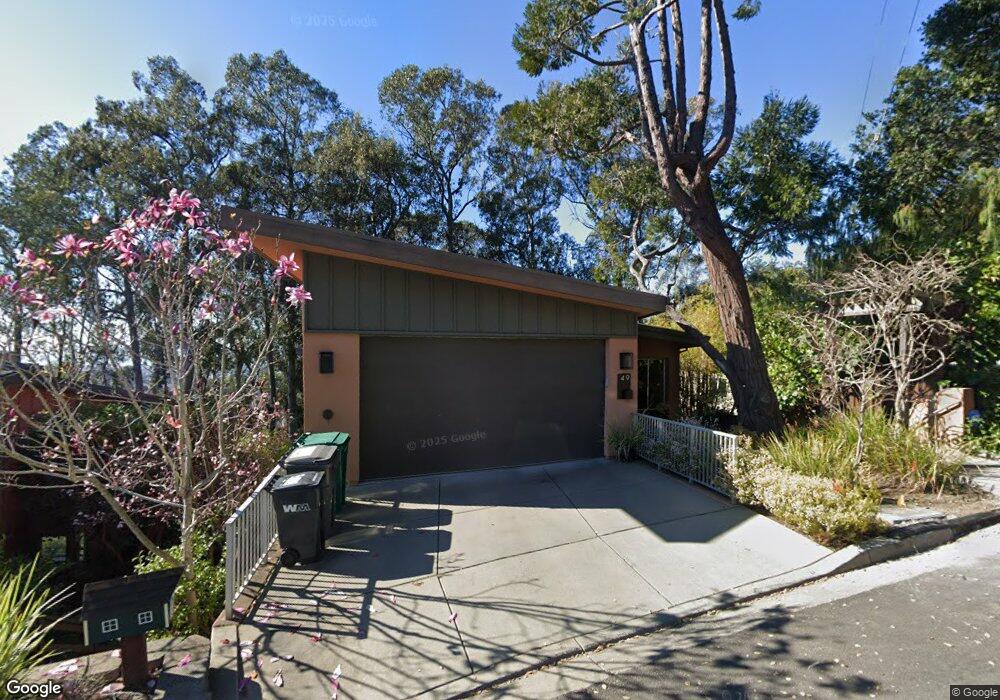
49 Evergreen Ln Berkeley, CA 94705
Claremont Hills NeighborhoodEstimated Value: $2,243,000 - $3,589,000
4
Beds
3
Baths
3,500
Sq Ft
$754/Sq Ft
Est. Value
About This Home
This home is located at 49 Evergreen Ln, Berkeley, CA 94705 and is currently estimated at $2,637,312, approximately $753 per square foot. 49 Evergreen Ln is a home located in Alameda County with nearby schools including Chabot Elementary School, Thornhill Elementary School, and Claremont Middle School.
Ownership History
Date
Name
Owned For
Owner Type
Purchase Details
Closed on
Jul 2, 2008
Sold by
Godfrey Jaime Talmadge
Bought by
Darrell Trevor J and Hagstrom Anna E
Current Estimated Value
Home Financials for this Owner
Home Financials are based on the most recent Mortgage that was taken out on this home.
Original Mortgage
$729,750
Outstanding Balance
$469,109
Interest Rate
6%
Mortgage Type
Purchase Money Mortgage
Estimated Equity
$2,168,203
Purchase Details
Closed on
Sep 9, 2003
Sold by
Ariel Development Group Xvii
Bought by
Godfrey Jaime Talmadge
Home Financials for this Owner
Home Financials are based on the most recent Mortgage that was taken out on this home.
Original Mortgage
$987,000
Interest Rate
3.62%
Mortgage Type
Purchase Money Mortgage
Create a Home Valuation Report for This Property
The Home Valuation Report is an in-depth analysis detailing your home's value as well as a comparison with similar homes in the area
Home Values in the Area
Average Home Value in this Area
Purchase History
| Date | Buyer | Sale Price | Title Company |
|---|---|---|---|
| Darrell Trevor J | $1,565,000 | Placer Title Company | |
| Godfrey Jaime Talmadge | $1,316,000 | Fidelity National Title Co |
Source: Public Records
Mortgage History
| Date | Status | Borrower | Loan Amount |
|---|---|---|---|
| Open | Darrell Trevor J | $729,750 | |
| Previous Owner | Godfrey Jaime Talmadge | $987,000 |
Source: Public Records
Tax History
| Year | Tax Paid | Tax Assessment Tax Assessment Total Assessment is a certain percentage of the fair market value that is determined by local assessors to be the total taxable value of land and additions on the property. | Land | Improvement |
|---|---|---|---|---|
| 2025 | $26,742 | $2,008,203 | $604,561 | $1,410,642 |
| 2024 | $26,742 | $1,968,702 | $592,710 | $1,382,992 |
| 2023 | $28,356 | $1,936,968 | $581,090 | $1,355,878 |
| 2022 | $27,791 | $1,892,001 | $569,700 | $1,329,301 |
| 2021 | $26,969 | $1,854,770 | $558,531 | $1,303,239 |
| 2020 | $26,679 | $1,842,693 | $552,808 | $1,289,885 |
| 2019 | $25,927 | $1,806,573 | $541,972 | $1,264,601 |
| 2018 | $25,378 | $1,771,157 | $531,347 | $1,239,810 |
| 2017 | $24,502 | $1,736,430 | $520,929 | $1,215,501 |
| 2016 | $23,933 | $1,702,390 | $510,717 | $1,191,673 |
| 2015 | $23,819 | $1,676,834 | $503,050 | $1,173,784 |
| 2014 | $24,378 | $1,644,000 | $493,200 | $1,150,800 |
Source: Public Records
Map
Nearby Homes
- 2 Gravatt Dr
- 0 Gravatt Dr Unit 41122154
- 190 Stonewall Rd
- 641 Alvarado Rd
- 260 Alvarado Rd
- 1488 Alvarado Rd
- 142 Gravatt Dr
- 150 Vicente Rd
- 7723 Claremont Ave
- 0 Tunnel Rd
- 29 Live Oak Rd
- 204 El Camino Real
- 0 Dartmouth Dr
- 2817 Palm Ct
- 1102 Grand View Dr
- 1215 Alvarado Rd
- 1426 Grand View Dr
- 2632 Warring St Unit 3
- 1375 Alvarado Rd
- 2962 Piedmont Ave
- 41 Evergreen Ln
- 57 Evergreen Ln
- 33 Evergreen Ln
- 65 Evergreen Ln
- 25 Evergreen Ln
- 7360 Claremont Ave
- 43 Slater Ln
- 7370 Claremont Ave
- 42 Slater Ln
- 17 Evergreen Ln
- 7380 Claremont Ave
- 73 Evergreen Ln
- 68 Evergreen Ln
- 9 Evergreen Ln
- 36 Slater Ln
- 29 Slater Ln
- 10 Evergreen Ln
- 85 Evergreen Ln
- 80 Evergreen Ln
- 1 Evergreen Ln
Your Personal Tour Guide
Ask me questions while you tour the home.