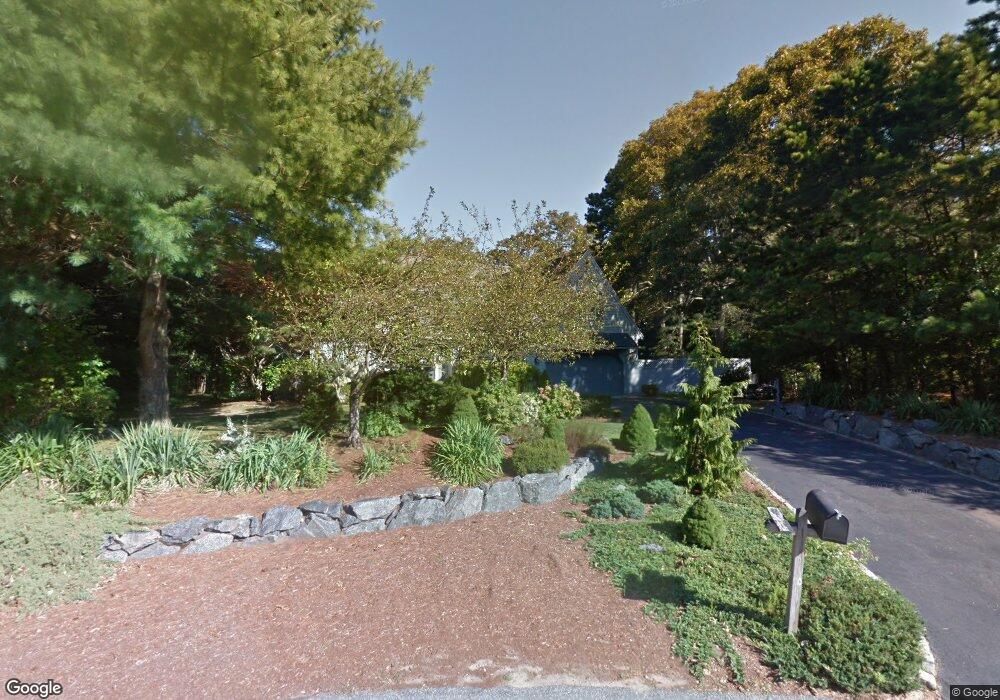
49 Marla Ln East Falmouth, MA 02536
Hatchville NeighborhoodEstimated Value: $942,000 - $1,264,000
4
Beds
3
Baths
1,501
Sq Ft
$702/Sq Ft
Est. Value
About This Home
This home is located at 49 Marla Ln, East Falmouth, MA 02536 and is currently estimated at $1,054,403, approximately $702 per square foot. 49 Marla Ln is a home located in Barnstable County with nearby schools including Mullen-Hall School, Morse Pond School, and Lawrence School.
Ownership History
Date
Name
Owned For
Owner Type
Purchase Details
Closed on
Sep 10, 2001
Sold by
Byron Michael P and Byron Jacqueline T
Bought by
Ahigian John R and Ahigian Iva A
Current Estimated Value
Home Financials for this Owner
Home Financials are based on the most recent Mortgage that was taken out on this home.
Original Mortgage
$275,000
Interest Rate
7.05%
Mortgage Type
Purchase Money Mortgage
Purchase Details
Closed on
Sep 9, 1999
Sold by
Casalegno Thomas W and Casalegno T H
Bought by
Byron Michael P and Byron Jacqueline T
Create a Home Valuation Report for This Property
The Home Valuation Report is an in-depth analysis detailing your home's value as well as a comparison with similar homes in the area
Home Values in the Area
Average Home Value in this Area
Purchase History
| Date | Buyer | Sale Price | Title Company |
|---|---|---|---|
| Ahigian John R | $399,000 | -- | |
| Ahigian John R | $399,000 | -- | |
| Byron Michael P | $260,000 | -- | |
| Byron Michael P | $260,000 | -- |
Source: Public Records
Mortgage History
| Date | Status | Borrower | Loan Amount |
|---|---|---|---|
| Open | Byron Michael P | $294,000 | |
| Closed | Byron Michael P | $171,000 | |
| Closed | Byron Michael P | $275,000 |
Source: Public Records
Tax History Compared to Growth
Tax History
| Year | Tax Paid | Tax Assessment Tax Assessment Total Assessment is a certain percentage of the fair market value that is determined by local assessors to be the total taxable value of land and additions on the property. | Land | Improvement |
|---|---|---|---|---|
| 2025 | $5,099 | $868,600 | $326,600 | $542,000 |
| 2024 | $4,886 | $778,000 | $284,400 | $493,600 |
| 2023 | $4,105 | $593,200 | $227,500 | $365,700 |
| 2022 | $4,143 | $514,700 | $212,700 | $302,000 |
| 2021 | $4,073 | $479,200 | $212,700 | $266,500 |
| 2020 | $3,939 | $458,500 | $193,400 | $265,100 |
| 2019 | $3,871 | $452,200 | $193,400 | $258,800 |
| 2018 | $3,811 | $443,100 | $193,400 | $249,700 |
| 2017 | $3,693 | $432,900 | $193,400 | $239,500 |
| 2016 | $3,623 | $432,900 | $193,400 | $239,500 |
| 2015 | $3,545 | $432,900 | $193,400 | $239,500 |
| 2014 | $3,518 | $431,600 | $193,500 | $238,100 |
Source: Public Records
Map
Nearby Homes