49 Nichols St Danvers, MA 01923
Estimated Value: $698,949 - $809,000
3
Beds
2
Baths
1,747
Sq Ft
$426/Sq Ft
Est. Value
About This Home
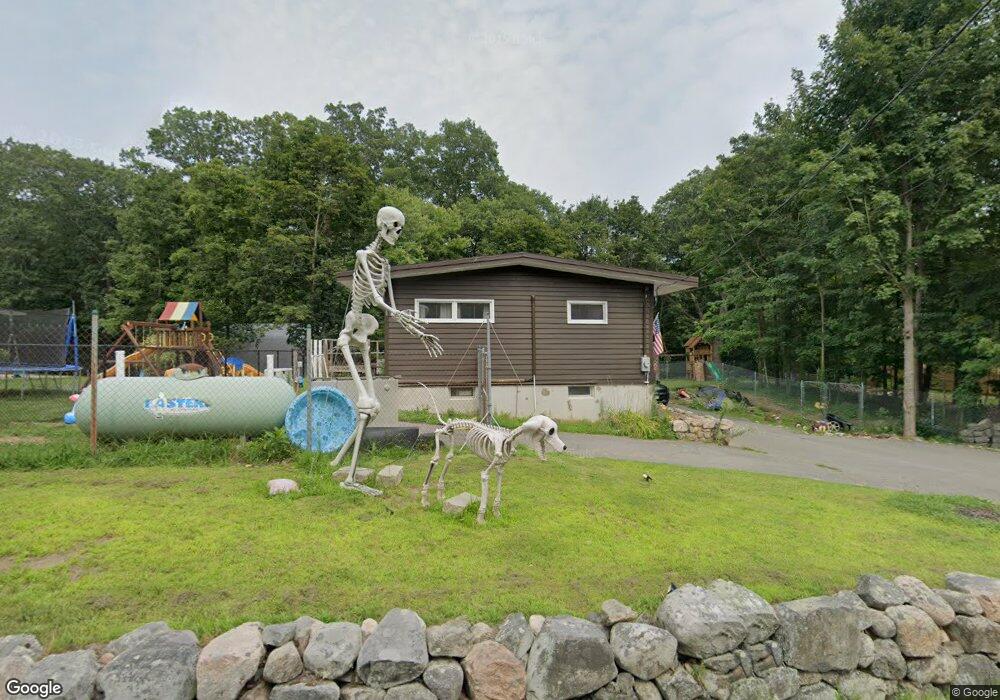
This home is located at 49 Nichols St, Danvers, MA 01923 and is currently estimated at $744,237, approximately $426 per square foot. 49 Nichols St is a home located in Essex County with nearby schools including St. Mary of the Annunciation School and St. John's Prep.
Ownership History
Date
Name
Owned For
Owner Type
Purchase Details
Closed on
Jun 26, 2020
Sold by
Elisabeth Nichols Clay T and Elisabeth Clay
Bought by
Clay Heather A and Clay John E
Current Estimated Value
Purchase Details
Closed on
Jan 28, 2019
Sold by
Elizabeth N Clay Ret and Clay
Bought by
Elisabeth Nichols Clay T and Elisabeth Clay
Purchase Details
Closed on
Jul 27, 2012
Sold by
Nichols Street 2 Rt and Clay
Bought by
Elizabeth N Clay Ret and Clay
Purchase Details
Closed on
Mar 8, 2004
Sold by
Clay Tr Earl W and Clay Elizabeth N
Bought by
Clay Tr Elizabeth N
Create a Home Valuation Report for This Property
The Home Valuation Report is an in-depth analysis detailing your home's value as well as a comparison with similar homes in the area
Home Values in the Area
Average Home Value in this Area
Purchase History
| Date | Buyer | Sale Price | Title Company |
|---|---|---|---|
| Clay Heather A | -- | None Available | |
| Elisabeth Nichols Clay T | -- | -- | |
| Elizabeth N Clay Ret | -- | -- | |
| Elizabeth N Clay Ret | -- | -- | |
| Clay Tr Elizabeth N | -- | -- |
Source: Public Records
Tax History Compared to Growth
Tax History
| Year | Tax Paid | Tax Assessment Tax Assessment Total Assessment is a certain percentage of the fair market value that is determined by local assessors to be the total taxable value of land and additions on the property. | Land | Improvement |
|---|---|---|---|---|
| 2025 | $6,594 | $600,000 | $378,900 | $221,100 |
| 2024 | $6,862 | $617,600 | $398,400 | $219,200 |
| 2023 | $6,665 | $567,200 | $360,800 | $206,400 |
| 2022 | $6,173 | $487,600 | $300,800 | $186,800 |
| 2021 | $5,720 | $428,500 | $272,600 | $155,900 |
| 2020 | $5,773 | $442,000 | $296,300 | $145,700 |
| 2019 | $5,518 | $415,500 | $270,800 | $144,700 |
| 2018 | $5,255 | $388,100 | $260,300 | $127,800 |
| 2017 | $5,138 | $362,100 | $236,300 | $125,800 |
| 2016 | $4,900 | $345,100 | $225,800 | $119,300 |
| 2015 | $4,542 | $304,600 | $195,800 | $108,800 |
Source: Public Records
Map
Nearby Homes
- 11 Spring St
- 10 Colantoni Dr
- 100 Kirkbride Dr Unit 119
- 519 Maple St
- 12 Salvatore Cir
- 12 Whipple St
- 26 Mohawk St
- 78 North St
- 1 Robert Rd
- 4 Chatham Ln
- 53 Centre St
- 6 Kimberly Dr
- 267 Centre St
- 200 North St Unit 31A
- 200 North St
- 103 Newbury St Unit 3
- 2 Pat Dr
- 40 Village Rd Unit 1108
- 40 Village Rd Unit 1601
- 4 Butler Ave