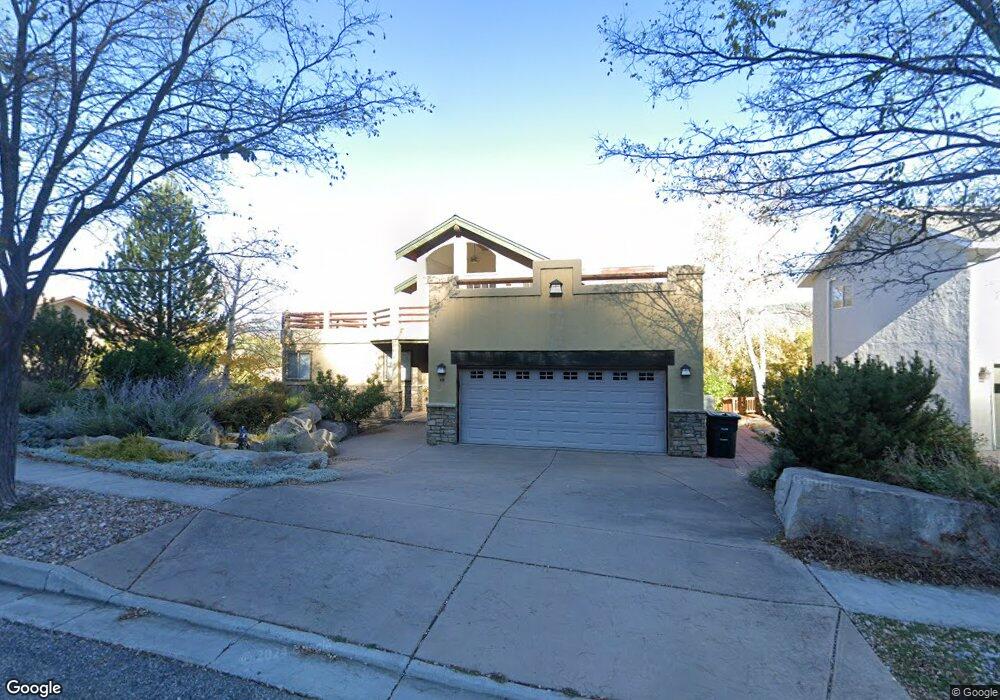
49 Ophir Dr Durango, CO 81301
Skyridge NeighborhoodEstimated Value: $1,597,000 - $1,890,000
5
Beds
4
Baths
4,812
Sq Ft
$358/Sq Ft
Est. Value
About This Home
This home is located at 49 Ophir Dr, Durango, CO 81301 and is currently estimated at $1,721,666, approximately $357 per square foot. 49 Ophir Dr is a home located in La Plata County with nearby schools including Park Elementary School, Escalante Middle School, and Durango High School.
Ownership History
Date
Name
Owned For
Owner Type
Purchase Details
Closed on
Dec 11, 2017
Sold by
The Trujillo Living Trust and Trujillo Ronald R
Bought by
Voldstad Peter A and Voldstad Ann M
Current Estimated Value
Purchase Details
Closed on
Sep 14, 2016
Sold by
Trujillo Ron R and Trujillo Felicia S
Bought by
Trujillo Ronald R and Trujillo Felicial S
Purchase Details
Closed on
Aug 31, 2006
Sold by
The Simpson Family Lp
Bought by
Trujillo Ron R and Trujillo Felicia S
Home Financials for this Owner
Home Financials are based on the most recent Mortgage that was taken out on this home.
Original Mortgage
$562,500
Interest Rate
6.75%
Mortgage Type
Purchase Money Mortgage
Purchase Details
Closed on
Sep 22, 2000
Bought by
Voldstad Peter A and Voldstad Ann M
Create a Home Valuation Report for This Property
The Home Valuation Report is an in-depth analysis detailing your home's value as well as a comparison with similar homes in the area
Home Values in the Area
Average Home Value in this Area
Purchase History
| Date | Buyer | Sale Price | Title Company |
|---|---|---|---|
| Voldstad Peter A | $918,300 | Land Title Guarantee Co | |
| Trujillo Ronald R | -- | Attorney | |
| Trujillo Ron R | $750,000 | Land Title | |
| Voldstad Peter A | $69,000 | -- |
Source: Public Records
Mortgage History
| Date | Status | Borrower | Loan Amount |
|---|---|---|---|
| Previous Owner | Trujillo Ron R | $562,500 |
Source: Public Records
Tax History
| Year | Tax Paid | Tax Assessment Tax Assessment Total Assessment is a certain percentage of the fair market value that is determined by local assessors to be the total taxable value of land and additions on the property. | Land | Improvement |
|---|---|---|---|---|
| 2025 | $3,740 | $96,790 | $15,350 | $81,440 |
| 2024 | $3,740 | $96,790 | $15,350 | $81,440 |
| 2023 | $3,182 | $82,640 | $15,210 | $67,430 |
| 2022 | $2,794 | $85,940 | $15,820 | $70,120 |
| 2021 | $2,806 | $70,690 | $11,710 | $58,980 |
| 2020 | $2,724 | $70,840 | $11,590 | $59,250 |
| 2019 | $2,605 | $70,840 | $11,590 | $59,250 |
| 2018 | $2,446 | $67,340 | $10,960 | $56,380 |
| 2017 | $2,392 | $67,340 | $10,960 | $56,380 |
| 2016 | $2,813 | $86,300 | $10,690 | $75,610 |
| 2015 | $2,635 | $86,300 | $10,690 | $75,610 |
| 2014 | -- | $74,110 | $10,690 | $63,420 |
| 2013 | -- | $74,110 | $10,690 | $63,420 |
Source: Public Records
Map
Nearby Homes
- 311 Hillcrest Dr Unit 4
- 229 Jenkins Ranch Rd Unit D
- 105 Tierra Vista Dr
- 126 Linda Ct
- 210 Jenkins Ranch Rd
- 205 Jenkins Ranch Rd Unit A
- 35 Valle Vista Way
- 24 Sage Hill Ct
- 570 Jenkins Ranch Rd
- 4678 County Road 240
- 1100 Goeglein Gulch Rd Unit 254
- 1100 Goeglein Gulch Rd Unit 155
- 1100 Goeglein Gulch Rd Unit 223
- 1200 Florida Rd Unit 33
- 1200 Florida Rd Unit 17
- 2801 Elm Place
- 900 Florida Rd
- 4228 County Road 250
- 6 Ferringway Cir Unit 30
- 6 Ferringway Cir Unit 18
- 47 Ophir Dr
- 51 Ophir Dr
- 45 Ophir Dr
- 3 Lizardhead Dr
- 54 Ophir Dr
- 43 Ophir Dr
- 5 Lizardhead Dr
- 46 Ophir Dr
- 410 Jenkins Ranch Rd
- 10 Lizardhead Dr
- 7 Lizardhead Dr
- 412 Jenkins
- 10 Lizard Head Dr
- 412 Jenkins Ranch Rd
- 414 Jenkins Ranch Rd
- 416 Jenkins Ranch Rd
- 41 Ophir Dr
- 418 Jenkins Ranch Rd
- 42 Ophir Dr
- 408 Jenkins Ranch Rd
Your Personal Tour Guide
Ask me questions while you tour the home.