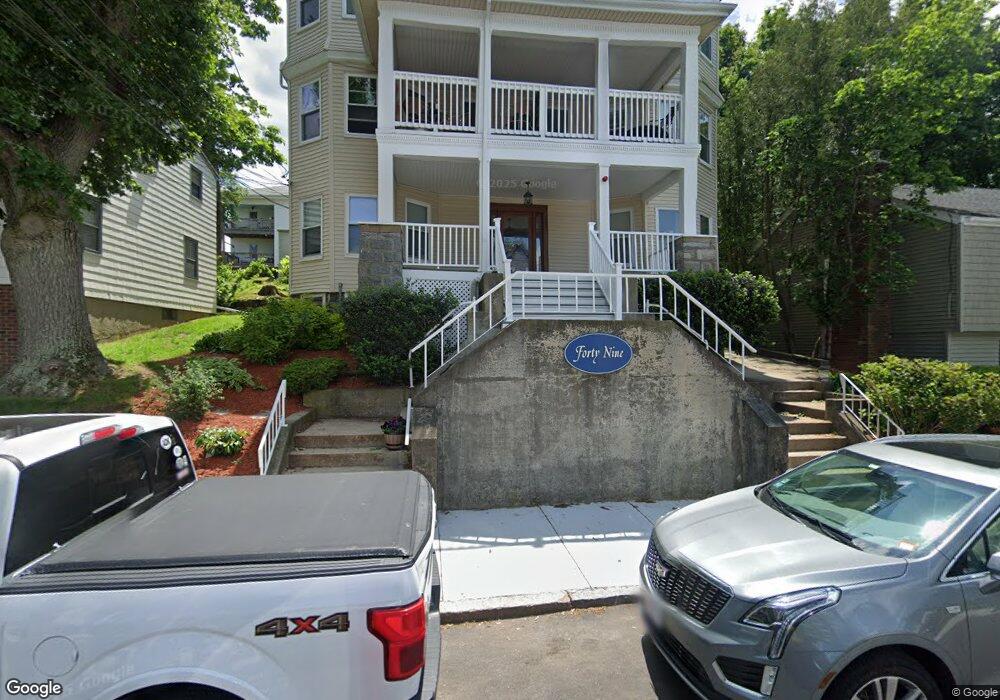
49 Sagamore Ave Unit 3B Winthrop, MA 02152
Downtown Winthrop NeighborhoodEstimated Value: $433,000 - $592,000
2
Beds
1
Bath
1,079
Sq Ft
$458/Sq Ft
Est. Value
About This Home
This home is located at 49 Sagamore Ave Unit 3B, Winthrop, MA 02152 and is currently estimated at $494,156, approximately $457 per square foot. 49 Sagamore Ave Unit 3B is a home located in Suffolk County with nearby schools including William P. Gorman/Fort Banks Elementary School, Arthur T. Cummings Elementary School, and Winthrop Middle School.
Ownership History
Date
Name
Owned For
Owner Type
Purchase Details
Closed on
Apr 21, 2010
Sold by
Damato Hillary G and Damato Frank P
Bought by
Witherell Jeremy A
Current Estimated Value
Home Financials for this Owner
Home Financials are based on the most recent Mortgage that was taken out on this home.
Original Mortgage
$202,268
Outstanding Balance
$133,847
Interest Rate
4.87%
Mortgage Type
FHA
Estimated Equity
$360,309
Purchase Details
Closed on
Jun 27, 2008
Sold by
Trotta Maria T
Bought by
Damato Frank P and Gannon Hillary
Home Financials for this Owner
Home Financials are based on the most recent Mortgage that was taken out on this home.
Original Mortgage
$198,879
Interest Rate
6.07%
Mortgage Type
Purchase Money Mortgage
Purchase Details
Closed on
Oct 31, 2001
Sold by
Callihan Michelle M and Callihan Roy E
Bought by
Sherman Aaron D
Home Financials for this Owner
Home Financials are based on the most recent Mortgage that was taken out on this home.
Original Mortgage
$180,405
Interest Rate
6.82%
Mortgage Type
Purchase Money Mortgage
Create a Home Valuation Report for This Property
The Home Valuation Report is an in-depth analysis detailing your home's value as well as a comparison with similar homes in the area
Home Values in the Area
Average Home Value in this Area
Purchase History
| Date | Buyer | Sale Price | Title Company |
|---|---|---|---|
| Witherell Jeremy A | $206,000 | -- | |
| Damato Frank P | $202,000 | -- | |
| Sherman Aaron D | $189,900 | -- |
Source: Public Records
Mortgage History
| Date | Status | Borrower | Loan Amount |
|---|---|---|---|
| Open | Witherell Jeremy A | $202,268 | |
| Previous Owner | Damato Frank P | $198,879 | |
| Previous Owner | Sherman Aaron D | $181,500 | |
| Previous Owner | Sherman Aaron D | $180,405 | |
| Previous Owner | Sherman Aaron D | $28,700 | |
| Previous Owner | Sherman Aaron D | $98,500 |
Source: Public Records
Tax History Compared to Growth
Tax History
| Year | Tax Paid | Tax Assessment Tax Assessment Total Assessment is a certain percentage of the fair market value that is determined by local assessors to be the total taxable value of land and additions on the property. | Land | Improvement |
|---|---|---|---|---|
| 2025 | $3,870 | $375,000 | $0 | $375,000 |
| 2024 | $3,643 | $349,600 | $0 | $349,600 |
| 2023 | $3,653 | $341,400 | $0 | $341,400 |
| 2022 | $3,795 | $322,700 | $0 | $322,700 |
| 2021 | $3,885 | $306,400 | $0 | $306,400 |
| 2020 | $3,748 | $297,000 | $0 | $297,000 |
| 2019 | $3,730 | $283,000 | $0 | $283,000 |
| 2018 | $3,051 | $215,500 | $0 | $215,500 |
| 2017 | $2,960 | $205,400 | $0 | $205,400 |
| 2016 | $3,011 | $195,900 | $0 | $195,900 |
| 2015 | $2,755 | $192,100 | $0 | $192,100 |
| 2014 | $2,977 | $191,100 | $0 | $191,100 |
Source: Public Records
Map
Nearby Homes
- 41 Summit Ave
- 80 Shirley St
- 249 Winthrop Shore Dr Unit 6
- 5 Quincy Ave
- 130 Shirley St Unit 204
- 130 Shirley St Unit 202
- 144 Quincy Ave
- 10 Beach Rd Unit 1
- 2 Deane Ave
- 800 Governors Dr Unit 6
- 1100 Governors Dr Unit 6
- 800 Governors Dr Unit 30
- 1000 Governors Dr Unit 25
- 441 Winthrop St
- 426 Winthrop St
- 50-52 Wilshire St
- 23 Trident Ave Unit 2
- 53 Trident Ave Unit 103
- 53 Trident Ave Unit 303
- 37 Trident Ave
- 49 Sagamore Ave Unit 3A
- 49 Sagamore Ave Unit 2B
- 49 Sagamore Ave Unit 2A
- 49 Sagamore Ave Unit 1B
- 49 Sagamore Ave Unit 1A
- 43 Sagamore Ave
- 43 Sagamore Ave Unit 1
- 55 Sagamore Ave
- 39 Sagamore Ave Unit 1
- 39 Sagamore Ave
- 39 Sagamore Ave Unit 2
- 50 Sagamore Ave
- 46 Sagamore Ave
- 56 Sagamore Ave
- 35 Sagamore Ave Unit 2
- 35 Sagamore Ave
- 35 Sagamore Ave Unit 1
- 40 Sagamore Ave
- 59 Sagamore Ave
- 36 Sagamore Ave