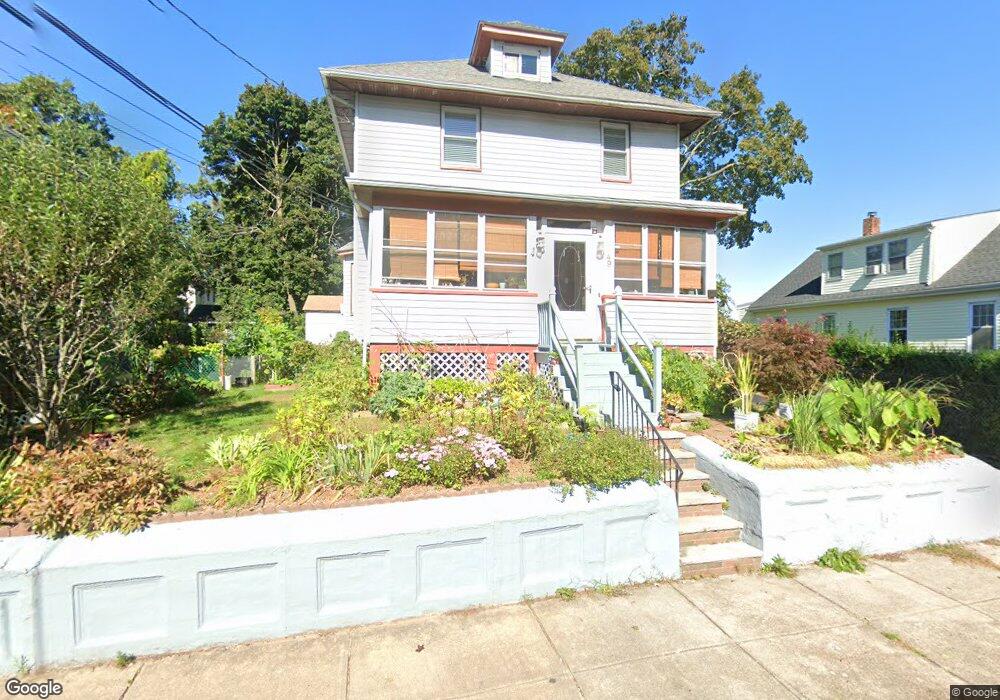
49 Schiller Rd West Roxbury, MA 02132
Upper Washington-Spring Street NeighborhoodEstimated Value: $675,000 - $734,000
3
Beds
2
Baths
1,371
Sq Ft
$522/Sq Ft
Est. Value
About This Home
This home is located at 49 Schiller Rd, West Roxbury, MA 02132 and is currently estimated at $715,797, approximately $522 per square foot. 49 Schiller Rd is a home located in Norfolk County with nearby schools including Catholic Memorial School.
Ownership History
Date
Name
Owned For
Owner Type
Purchase Details
Closed on
Jul 23, 2007
Sold by
Deutsche Bank Natl T C
Bought by
Chan Im I and Chan Man F
Current Estimated Value
Home Financials for this Owner
Home Financials are based on the most recent Mortgage that was taken out on this home.
Original Mortgage
$263,200
Outstanding Balance
$164,852
Interest Rate
6.54%
Mortgage Type
Purchase Money Mortgage
Estimated Equity
$550,945
Purchase Details
Closed on
Apr 27, 2007
Sold by
Tarmy Dorothy and Deutsche Bank Natl T C
Bought by
Deutsche Bank Natl T C
Create a Home Valuation Report for This Property
The Home Valuation Report is an in-depth analysis detailing your home's value as well as a comparison with similar homes in the area
Home Values in the Area
Average Home Value in this Area
Purchase History
| Date | Buyer | Sale Price | Title Company |
|---|---|---|---|
| Chan Im I | $329,000 | -- | |
| Deutsche Bank Natl T C | $297,000 | -- |
Source: Public Records
Mortgage History
| Date | Status | Borrower | Loan Amount |
|---|---|---|---|
| Open | Chan Im I | $263,200 |
Source: Public Records
Tax History
| Year | Tax Paid | Tax Assessment Tax Assessment Total Assessment is a certain percentage of the fair market value that is determined by local assessors to be the total taxable value of land and additions on the property. | Land | Improvement |
|---|---|---|---|---|
| 2025 | $7,527 | $650,000 | $190,100 | $459,900 |
| 2024 | $5,962 | $547,000 | $193,800 | $353,200 |
| 2023 | $5,875 | $547,000 | $193,800 | $353,200 |
| 2022 | $5,411 | $497,300 | $176,200 | $321,100 |
| 2021 | $4,878 | $457,200 | $167,800 | $289,400 |
| 2020 | $4,690 | $444,100 | $156,300 | $287,800 |
| 2019 | $4,407 | $418,100 | $129,100 | $289,000 |
| 2018 | $4,056 | $387,000 | $129,100 | $257,900 |
| 2017 | $4,057 | $383,100 | $129,100 | $254,000 |
| 2016 | $3,975 | $361,400 | $129,100 | $232,300 |
| 2015 | $4,131 | $341,100 | $137,900 | $203,200 |
| 2014 | $4,011 | $318,800 | $137,900 | $180,900 |
Source: Public Records
Map
Nearby Homes
- 25 Rockland St Unit 5
- 25R Rockland St Unit 6
- 8 Sumner St
- 111 Schiller Rd
- 94 Rockland St
- 109 Rockland St
- 4 Mount Hope St
- 231 Grove St
- 5170 Washington St Unit 107
- 231-245 Grove St
- 49 Greenhood St
- 153 Colburn St
- 150 Grove St
- 191 Glenellen Rd
- 41 Vogel St
- 2505 Centre St
- 132 Whitehall St
- 42 Churchill Place
- 115 Grove St Unit 1
- 17 Vogel St
Your Personal Tour Guide
Ask me questions while you tour the home.