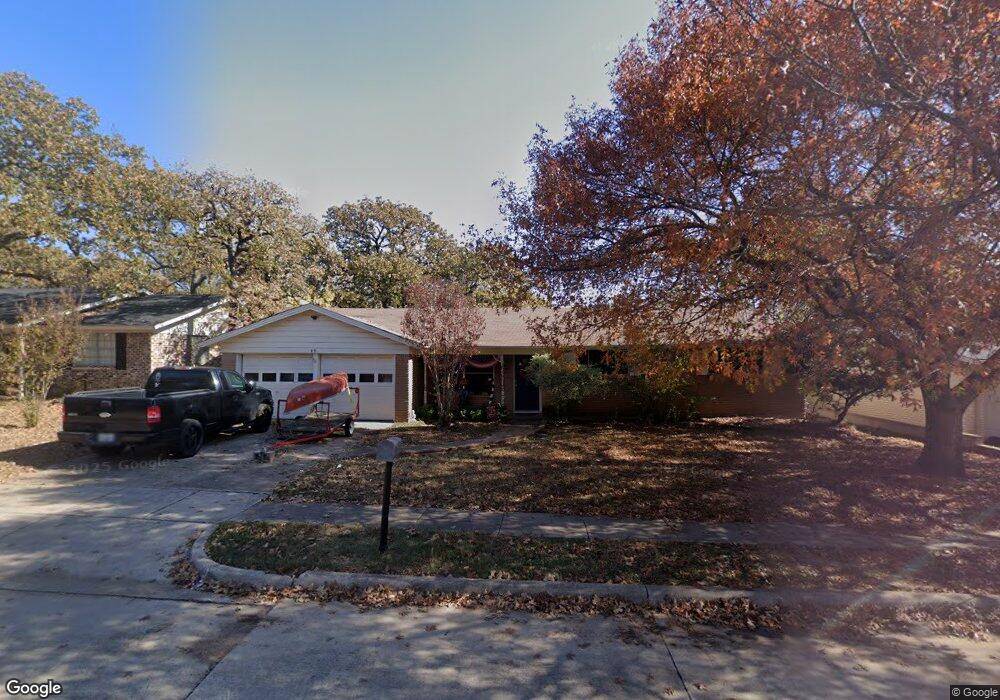
49 Stonegate Dr Bedford, TX 76022
Estimated Value: $262,676 - $310,000
3
Beds
2
Baths
1,422
Sq Ft
$201/Sq Ft
Est. Value
About This Home
This home is located at 49 Stonegate Dr, Bedford, TX 76022 and is currently estimated at $285,919, approximately $201 per square foot. 49 Stonegate Dr is a home located in Tarrant County with nearby schools including Stonegate Elementary School, Central J High School, and L.D. Bell High School.
Ownership History
Date
Name
Owned For
Owner Type
Purchase Details
Closed on
May 31, 2016
Sold by
Pflaum Mark
Bought by
Horizon Trust and Christopher Alcedo Ira
Current Estimated Value
Purchase Details
Closed on
Jan 28, 2016
Sold by
Pflaum Danette Renee
Bought by
Pflaum Mark Andrew
Purchase Details
Closed on
Jul 25, 2012
Sold by
Pflaum Mark and Pflaum Renee
Bought by
Pflaum Mark and Pflaum Danette R
Home Financials for this Owner
Home Financials are based on the most recent Mortgage that was taken out on this home.
Original Mortgage
$103,705
Interest Rate
2.75%
Mortgage Type
VA
Purchase Details
Closed on
Jan 16, 2004
Sold by
Rockwell Jack Lee and Rockwell Barbara
Bought by
Pflaum Mark and Pflaum Renee
Home Financials for this Owner
Home Financials are based on the most recent Mortgage that was taken out on this home.
Original Mortgage
$111,050
Interest Rate
5.9%
Mortgage Type
VA
Create a Home Valuation Report for This Property
The Home Valuation Report is an in-depth analysis detailing your home's value as well as a comparison with similar homes in the area
Home Values in the Area
Average Home Value in this Area
Purchase History
| Date | Buyer | Sale Price | Title Company |
|---|---|---|---|
| Horizon Trust | -- | None Available | |
| Pflaum Mark Andrew | -- | None Available | |
| Pflaum Mark | -- | None Available | |
| Pflaum Mark | -- | Safeco Land Title |
Source: Public Records
Mortgage History
| Date | Status | Borrower | Loan Amount |
|---|---|---|---|
| Previous Owner | Pflaum Mark | $103,705 | |
| Previous Owner | Pflaum Mark | $111,050 |
Source: Public Records
Tax History Compared to Growth
Tax History
| Year | Tax Paid | Tax Assessment Tax Assessment Total Assessment is a certain percentage of the fair market value that is determined by local assessors to be the total taxable value of land and additions on the property. | Land | Improvement |
|---|---|---|---|---|
| 2025 | $3,901 | $200,344 | $65,000 | $135,344 |
| 2024 | $3,901 | $200,344 | $65,000 | $135,344 |
| 2023 | $3,564 | $185,828 | $45,000 | $140,828 |
| 2022 | $3,610 | $165,279 | $45,000 | $120,279 |
| 2021 | $3,504 | $148,746 | $45,000 | $103,746 |
| 2020 | $3,935 | $165,489 | $45,000 | $120,489 |
| 2019 | $4,048 | $166,626 | $45,000 | $121,626 |
| 2018 | $3,775 | $155,398 | $22,000 | $133,398 |
| 2017 | $3,551 | $146,782 | $22,000 | $124,782 |
| 2016 | $2,802 | $129,178 | $22,000 | $107,178 |
| 2015 | $2,369 | $105,300 | $18,000 | $87,300 |
| 2014 | $2,369 | $105,300 | $18,000 | $87,300 |
Source: Public Records
Map
Nearby Homes
- 1416 Wade Dr
- 604 Donna Ln
- 49 Coffee Tavern Rd
- 1236 King Dr
- 501 Merrill Dr
- 1213 Briar Dr
- 1108 Wade Dr
- 345 Somerset Cir
- 258 Somerset Terrace
- 1008 Russell Ln
- 140 Stonegate Ct
- 1112 Ann St
- 93 Regents Park
- 1204 Edgecliff Dr
- 933 Wade Dr
- 344 Bedford Ct E
- 341 Hurst Dr
- 1004 Overhill Dr
- 849 Russell Ln
- 2116 Tamworth Ct
- 53 Stonegate Dr
- 45 Stonegate Dr
- 1501 Wade Dr
- 1421 Wade Dr
- 57 Stonegate Dr
- 41 Stonegate Dr
- 48 Stonegate Dr
- 52 Stonegate Dr
- 1505 Wade Dr
- 42 Stonegate Dr
- 44 Stonegate Dr
- 1417 Wade Dr
- 61 Stonegate Dr
- 37 Stonegate Dr
- 1 Regents Park
- 1509 Wade Dr
- 4 Regents Park
- 5 Coffee Tavern Rd
- 1413 Wade Dr
- 34 Stonegate Dr