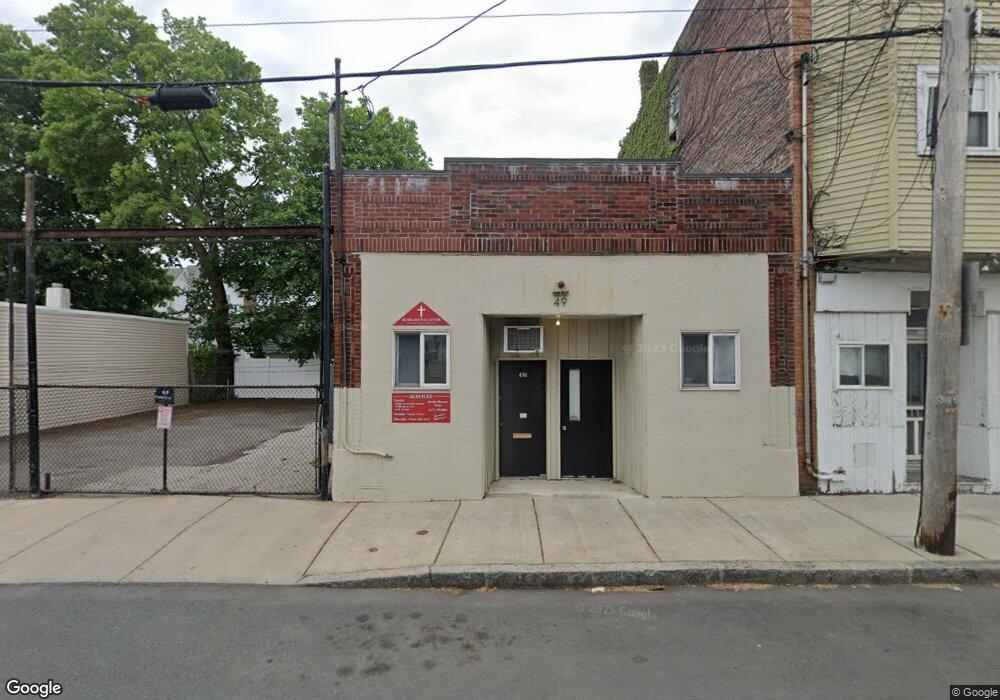
49 Union St Everett, MA 02149
Glendale Neighborhood
Studio
--
Bath
2,950
Sq Ft
3,267
Sq Ft Lot
About This Home
This home is located at 49 Union St, Everett, MA 02149. 49 Union St is a home located in Middlesex County with nearby schools including Everett High School and Pioneer Charter School of Science.
Ownership History
Date
Name
Owned For
Owner Type
Purchase Details
Closed on
Apr 27, 2011
Sold by
Fiore Tr John H
Bought by
Everett City Of
Home Financials for this Owner
Home Financials are based on the most recent Mortgage that was taken out on this home.
Original Mortgage
$550,000
Outstanding Balance
$382,224
Interest Rate
4.88%
Mortgage Type
Commercial
Purchase Details
Closed on
Jan 30, 2009
Sold by
Fiore John A and Fiore John H
Bought by
John Fiore Inc
Purchase Details
Closed on
Jan 1, 1981
Bought by
John Fiore Inc
Create a Home Valuation Report for This Property
The Home Valuation Report is an in-depth analysis detailing your home's value as well as a comparison with similar homes in the area
Home Values in the Area
Average Home Value in this Area
Purchase History
| Date | Buyer | Sale Price | Title Company |
|---|---|---|---|
| Everett City Of | -- | -- | |
| Everett City Of | -- | -- | |
| John Fiore Inc | -- | -- | |
| John Fiore Inc | -- | -- |
Source: Public Records
Mortgage History
| Date | Status | Borrower | Loan Amount |
|---|---|---|---|
| Open | John Fiore Inc | $550,000 |
Source: Public Records
Tax History
| Year | Tax Paid | Tax Assessment Tax Assessment Total Assessment is a certain percentage of the fair market value that is determined by local assessors to be the total taxable value of land and additions on the property. | Land | Improvement |
|---|---|---|---|---|
| 2025 | $10,670 | $463,900 | $325,000 | $138,900 |
| 2024 | $10,452 | $435,500 | $304,700 | $130,800 |
| 2023 | $10,562 | $416,500 | $292,500 | $124,000 |
| 2022 | $9,606 | $399,600 | $280,300 | $119,300 |
| 2021 | $8,855 | $381,700 | $268,100 | $113,600 |
| 2020 | $7,394 | $299,100 | $195,000 | $104,100 |
| 2019 | $10,285 | $291,600 | $195,000 | $96,600 |
| 2018 | $8,276 | $245,300 | $156,000 | $89,300 |
| 2017 | $8,159 | $228,600 | $143,000 | $85,600 |
| 2016 | $8,314 | $218,900 | $133,300 | $85,600 |
| 2015 | $8,636 | $218,900 | $133,300 | $85,600 |
Source: Public Records
Map
Nearby Homes
- 99 Florence St
- 20 Ferry St Unit B
- 114 Francis St
- 110 Ferry St
- 181 Chelsea St
- 27 Silver Rd
- 88 Garland St
- 138 Fremont Ave
- 20 Fairmount St
- 21 Hillside Ave Unit 21
- 124 Addison St Unit 15
- 7 Ingleside Ave
- 101 Springvale Ave
- 62 Madison Ave
- 24 Corey St Unit 101
- 78 Addison St Unit B
- 120 Sagamore Ave
- 86 Blossom St Unit 1
- 44 Lafayette Ave Unit 408
- 44 Lafayette Place Ave Unit 404
- 57 Union St
- 45 Union St
- 55 Union St
- 55 Union St Unit 55
- 55 Union St Unit 1
- 69 Irving St
- 50 Union St
- 50 Union St Unit 2
- 63 Irving St
- 70 Florence St
- 1571 Union St
- 1057 Union St Unit 2
- 1057 Union St
- 42 Union St
- 68 Florence St
- 58 Union St
- 58 Union St Unit 3
- 64 Florence St
- 59 Irving St
- 78 Florence St Unit 3
Your Personal Tour Guide
Ask me questions while you tour the home.