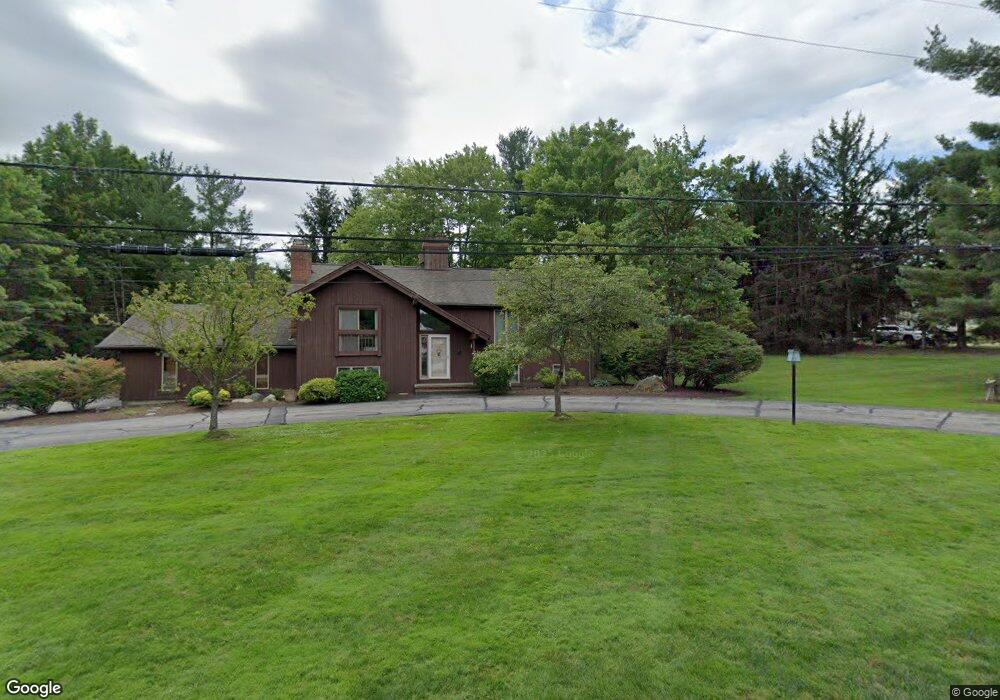
490 Falls Rd Chagrin Falls, OH 44022
Estimated Value: $640,069 - $713,000
4
Beds
3
Baths
3,218
Sq Ft
$215/Sq Ft
Est. Value
About This Home
This home is located at 490 Falls Rd, Chagrin Falls, OH 44022 and is currently estimated at $690,517, approximately $214 per square foot. 490 Falls Rd is a home located in Cuyahoga County with nearby schools including Gurney Elementary School, Chagrin Falls Intermediate Elementary School, and Chagrin Falls Middle School.
Ownership History
Date
Name
Owned For
Owner Type
Purchase Details
Closed on
Jun 13, 2012
Sold by
Crc Real Estate Investment Llc
Bought by
Catalano Cynthia A
Current Estimated Value
Home Financials for this Owner
Home Financials are based on the most recent Mortgage that was taken out on this home.
Original Mortgage
$216,000
Outstanding Balance
$92,124
Interest Rate
3.87%
Mortgage Type
New Conventional
Estimated Equity
$598,393
Purchase Details
Closed on
Jun 4, 2007
Sold by
Catalano Cynthia A
Bought by
Crc Real Estate Investment Llc
Purchase Details
Closed on
Jul 20, 1989
Sold by
Gross Sheldon M
Bought by
Edelman Donald S
Purchase Details
Closed on
Nov 16, 1976
Sold by
Mcnutt John R
Bought by
Gross Sheldon M
Purchase Details
Closed on
Jan 1, 1975
Bought by
Mcnutt John R
Create a Home Valuation Report for This Property
The Home Valuation Report is an in-depth analysis detailing your home's value as well as a comparison with similar homes in the area
Home Values in the Area
Average Home Value in this Area
Purchase History
| Date | Buyer | Sale Price | Title Company |
|---|---|---|---|
| Catalano Cynthia A | -- | Northstar Title Agency | |
| Crc Real Estate Investment Llc | -- | Chicago Title Insurance C | |
| Edelman Donald S | $180,000 | -- | |
| Gross Sheldon M | $15,000 | -- | |
| Mcnutt John R | -- | -- |
Source: Public Records
Mortgage History
| Date | Status | Borrower | Loan Amount |
|---|---|---|---|
| Open | Catalano Cynthia A | $216,000 |
Source: Public Records
Tax History
| Year | Tax Paid | Tax Assessment Tax Assessment Total Assessment is a certain percentage of the fair market value that is determined by local assessors to be the total taxable value of land and additions on the property. | Land | Improvement |
|---|---|---|---|---|
| 2024 | $10,143 | $164,500 | $24,500 | $140,000 |
| 2023 | $9,643 | $135,490 | $38,850 | $96,640 |
| 2022 | $10,200 | $135,490 | $38,850 | $96,640 |
| 2021 | $10,156 | $135,490 | $38,850 | $96,640 |
| 2020 | $8,804 | $108,400 | $31,080 | $77,320 |
| 2019 | $8,671 | $309,700 | $88,800 | $220,900 |
| 2018 | $8,325 | $108,400 | $31,080 | $77,320 |
| 2017 | $8,928 | $106,190 | $18,480 | $87,710 |
| 2016 | $8,015 | $106,190 | $18,480 | $87,710 |
| 2015 | $8,157 | $106,190 | $18,480 | $87,710 |
| 2014 | $8,157 | $106,190 | $18,480 | $87,710 |
Source: Public Records
Map
Nearby Homes
- 117 E Cottage St
- 190 Columbus St
- 117 Cleveland St
- 270 Chagrin Blvd
- 7059 Deepwood Dr
- 110 Emilia Ct
- 106 W Washington St
- 35 Hopewell Trail
- 81 Hall St
- 156 S Franklin St
- 7650 Blackford Dr
- 15813 Hemlock Rd
- 7658 Blackford Dr
- 207 S Main St
- 213 S Main St
- 219 S Main St
- 40 Highland Ln
- 225 S Main St
- 7771 Blackford Dr
- 318 Hillside Ln
Your Personal Tour Guide
Ask me questions while you tour the home.