490 Mapleleaf Dr Cincinnati, OH 45255
Estimated Value: $194,000 - $207,000
2
Beds
2
Baths
1,222
Sq Ft
$165/Sq Ft
Est. Value
About This Home
This home is located at 490 Mapleleaf Dr, Cincinnati, OH 45255 and is currently estimated at $201,702, approximately $165 per square foot. 490 Mapleleaf Dr is a home located in Clermont County with nearby schools including Withamsville-Tobasco Elementary School, West Clermont Middle School, and West Clermont High School.
Ownership History
Date
Name
Owned For
Owner Type
Purchase Details
Closed on
May 7, 2019
Sold by
Reed Brigitte J
Bought by
Gibbs Karen
Current Estimated Value
Home Financials for this Owner
Home Financials are based on the most recent Mortgage that was taken out on this home.
Original Mortgage
$69,500
Outstanding Balance
$60,855
Interest Rate
4%
Mortgage Type
Future Advance Clause Open End Mortgage
Estimated Equity
$140,847
Purchase Details
Closed on
Jun 12, 2002
Sold by
Broyles Eric D
Bought by
Reed Brigitte J
Purchase Details
Closed on
Aug 22, 2000
Sold by
Est Lawrence R Krusling
Bought by
Broyles Eric D and Raab Jill M
Home Financials for this Owner
Home Financials are based on the most recent Mortgage that was taken out on this home.
Original Mortgage
$79,900
Interest Rate
8.16%
Mortgage Type
New Conventional
Purchase Details
Closed on
Aug 16, 1995
Sold by
Haynes Patricia
Bought by
Krusling Lawrence R
Purchase Details
Closed on
Nov 9, 1992
Create a Home Valuation Report for This Property
The Home Valuation Report is an in-depth analysis detailing your home's value as well as a comparison with similar homes in the area
Purchase History
| Date | Buyer | Sale Price | Title Company |
|---|---|---|---|
| Gibbs Karen | $99,500 | Old Town Title Agency | |
| Reed Brigitte J | $103,000 | -- | |
| Broyles Eric D | $94,000 | -- | |
| Krusling Lawrence R | $91,000 | -- | |
| -- | $85,900 | -- |
Source: Public Records
Mortgage History
| Date | Status | Borrower | Loan Amount |
|---|---|---|---|
| Open | Gibbs Karen | $69,500 | |
| Previous Owner | Broyles Eric D | $79,900 | |
| Closed | Krusling Lawrence R | -- |
Source: Public Records
Tax History
| Year | Tax Paid | Tax Assessment Tax Assessment Total Assessment is a certain percentage of the fair market value that is determined by local assessors to be the total taxable value of land and additions on the property. | Land | Improvement |
|---|---|---|---|---|
| 2024 | $2,685 | $53,240 | $9,210 | $44,030 |
| 2023 | $2,689 | $53,240 | $9,210 | $44,030 |
| 2022 | $1,884 | $32,340 | $5,600 | $26,740 |
| 2021 | $1,892 | $32,340 | $5,600 | $26,740 |
| 2020 | $1,894 | $32,340 | $5,600 | $26,740 |
| 2019 | $1,191 | $23,770 | $5,320 | $18,450 |
| 2018 | $1,203 | $23,770 | $5,320 | $18,450 |
| 2017 | $1,534 | $23,770 | $5,320 | $18,450 |
| 2016 | $1,534 | $27,440 | $5,250 | $22,190 |
| 2015 | $1,489 | $27,440 | $5,250 | $22,190 |
| 2014 | $1,488 | $27,440 | $5,250 | $22,190 |
| 2013 | $1,555 | $28,360 | $5,500 | $22,860 |
Source: Public Records
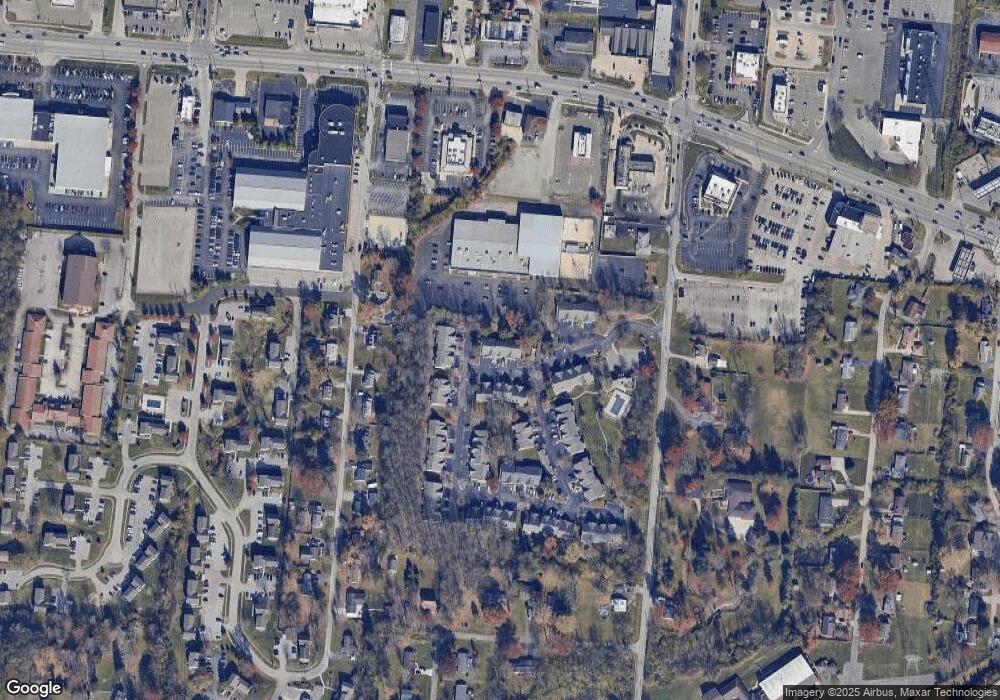
Map
Nearby Homes
- 492 Mapleleaf Dr
- 496 Mapleleaf Dr
- 4047 Mclean Dr
- 4077 Mclean Dr
- 4133 Brandonmore Dr
- 3904 Columbard Ln
- 425 Mcintosh Dr Unit 22A
- 488 Madeira Ct
- 637 Ellen Dr
- 8345 Cherry Ln
- 1333 Eight Mile Rd
- 8303 Tidewater Ct
- 595 Davis Rd
- 8372 Benton Ridge Ln
- 807 Nordyke Rd
- 671 Mccormick Ln
- 537 Davis Rd
- 4182 Mount Carmel Tobasco Rd
- 686 Loda Dr
- 541 Davis Rd
- 3990 Maplecove Ln Unit D
- 490 Mapleleaf Dr Unit D
- 492 Mapleport Way Unit 11D
- 492 Mapleport Way
- 492 Mapleport Way
- 3990 Maplecove Ln Unit 15E
- 3990 Maplecove Ln
- 3990 Maplecove Ln Unit 15C
- 3990 Maplecove Ln
- 3990 Maplecove Ln
- 490 Mapleleaf Dr
- 490 Mapleleaf Dr
- 490 Mapleleaf Dr Unit A
- 492 Mapleport Way Unit 11E
- 3990 Maplecove Ln Unit 15F
- 490 Mapleleaf Dr Unit 4E
- 492 Mapleport Way Unit B
- 492 Mapleport Way Unit A
- 3990 Maplecove Ln Unit B
- 490 Mapleleaf Dr Unit E
Your Personal Tour Guide
Ask me questions while you tour the home.